Abstract
This paper asks which point of the distribution of age at death the single phrase "life expectancy" refers to — the answer is the mean. The life-table distribution of age at death has three summaries: the mean, the middle (median lifespan) and the most common age (mode). They respond differently to the long left tail of young deaths, so they line up in that order and have drawn together over the decades. No new mathematical theorem or new law is claimed.
First, in the 2024 abridged life table, men's life expectancy is 81.09, the median lifespan 83.89, and the most common age at death 88; for women, 87.13, 90.04 and 92. Both line up as mean < median < mode (Section 4).
Second, the median lifespan is reproduced within 0.01 years of the published value (83.89 for men, 90.04 for women) by joining, with a straight line, the ages around which survivors fall below half of 100,000 births. The mode's peak is flat: for men the 4 ages 86–89, for women the 3 ages 91–93, all reach at least 97% of the peak (Section 4).
Third, this is the core of the paper. Removing young deaths moves the three by different amounts. Restricted to those who reach 65, men's mean rises by 3.38 years, the median by 1.38, and the mode by 0; for women, 2.25, 0.59 and 0. Even for those reaching 50, the mean moves more than twice as much as the median (Section 5).
Fourth, from 1947 to 2024, life expectancy rose by 31.03 years for men and 33.17 for women, more than the median lifespan (24.61 and 25.59). The gap between median and mean shrank from 9.22 to 2.79 years for men and from 10.49 to 2.91 for women. Since 1990 it has stayed within 2.79–3.21 years for men and 2.80–2.91 for women (Section 6).
Fifth, the separator is how much weight young deaths carry. The mean adds up every age at death, so young deaths pull it hard; the median looks only at which side half of people fall, so it moves a little; the mode looks only at the peak, so it does not move.
Sixth, "a life expectancy of 81" means neither that half of people live to that age nor that most die at it. In the life table, half of men live to 83.89 and half of women to 90.04.
Scope note: No new mathematical theorem or new law is claimed — life expectancy and median lifespan are defined and published as life-table functions. This paper adds the mode, sets the three side by side, and measures how differently they respond to young deaths. This paper is a structural interpretation describing the shape of numbers in public aggregate data; it is not medical advice, diagnosis, or a treatment recommendation. The author is not a physician. For decisions about individual health, consult a physician or medical institution. It is a preprint that has not been peer reviewed. It is not one person's outlook — all figures are period figures assuming each year's mortality stays fixed (M003). It does not say which summary is correct — the three answer different questions. The mode's trend over time is not treated — past life tables' deaths were not retrieved. About the data: the e-Stat life tables are used under the Public Data License (Version 2.0) and the Ministry's website figure data under its Public Data License (Version 1.0); the reproduced median, the mode and the restricted summaries were produced by processing them. Source: Ministry of Health, Labour and Welfare, "Abridged Life Tables for 2024" and its overview. What this paper adds is setting three summaries side by side, including the mode, and showing mean < median < mode for both sexes; measuring that removing young deaths moves them by different amounts (mean > median > mode = 0); and laying out, from Table 4, how the gap has shrunk since 1947.
1. Notation and question
- Life expectancy: life expectancy at age 0; the mean age at death in the life table.
- Median lifespan: the age by which exactly half of those born are expected to survive (published definition); the middle age at death.
- Mode: here, the single-year age at 1 or above with the largest number of life-table deaths; the most common age at death.
Question: Which point of the distribution of age at death does "life expectancy" refer to? How far is it from the other summaries, and why?
Observation 1.1: The life-table distribution of age at death peaks at high ages and trails a long tail to the left (young ages). The mean adds up every age, so it is pulled by this tail.
2. Preliminary look and design
Stated honestly: the design of this paper was decided after looking at the tables.
| Content | |
|---|---|
| Three summaries | From the 2024 abridged life tables (men, women): the mean (published life expectancy), the median (reproduced from survivors) and the mode (from deaths) |
| Effect of young deaths | Rebuild the three for those reaching ages 1, 50 and 65, and compare how far each moves |
| Over time | Table 4 of the Ministry's overview (median lifespan and life expectancy, 1947–2024) |
3. Data and their verification
Calculation 3.1 The retrieved files were fixed by SHA-256, and the following were checked.
| What was checked | Result |
|---|---|
| Rows of Table 4 | 20 rows from 1947 to 2024 |
| Table 4's "gap" column | Equals median − mean within rounding (at most 0.010 years) |
| Overview text vs Table 4 | 2024 median lifespans agree (83.89 men, 90.04 women) |
| Reproduced median lifespan | Differs from the published value by −0.003 years (men) and −0.005 (women) |
4. The three numbers for 2024
Calculation 4.1 Three summaries of the 2024 abridged life table
| Mean (life expectancy) | Median (median lifespan) | Mode | Median − mean | Mode − median | |
|---|---|---|---|---|---|
| Men | 81.09 | 83.89 | 88 | 2.80 y | 4.11 y |
| Women | 87.13 | 90.04 | 92 | 2.91 y | 1.96 y |
Observation 4.2: For both sexes, mean < median < mode. The mean and mode lie 6.91 years apart for men and 4.87 for women.
Observation 4.3: The mode's peak is flat. For men the ages 86–89 and for women 91–93 all reach at least 97% of the peak (men: 4079 at 87, 4094 at 88, 4042 at 89 per 100,000 births). Read the mode not as deaths clustering sharply at one age, but as the peak lying around there.
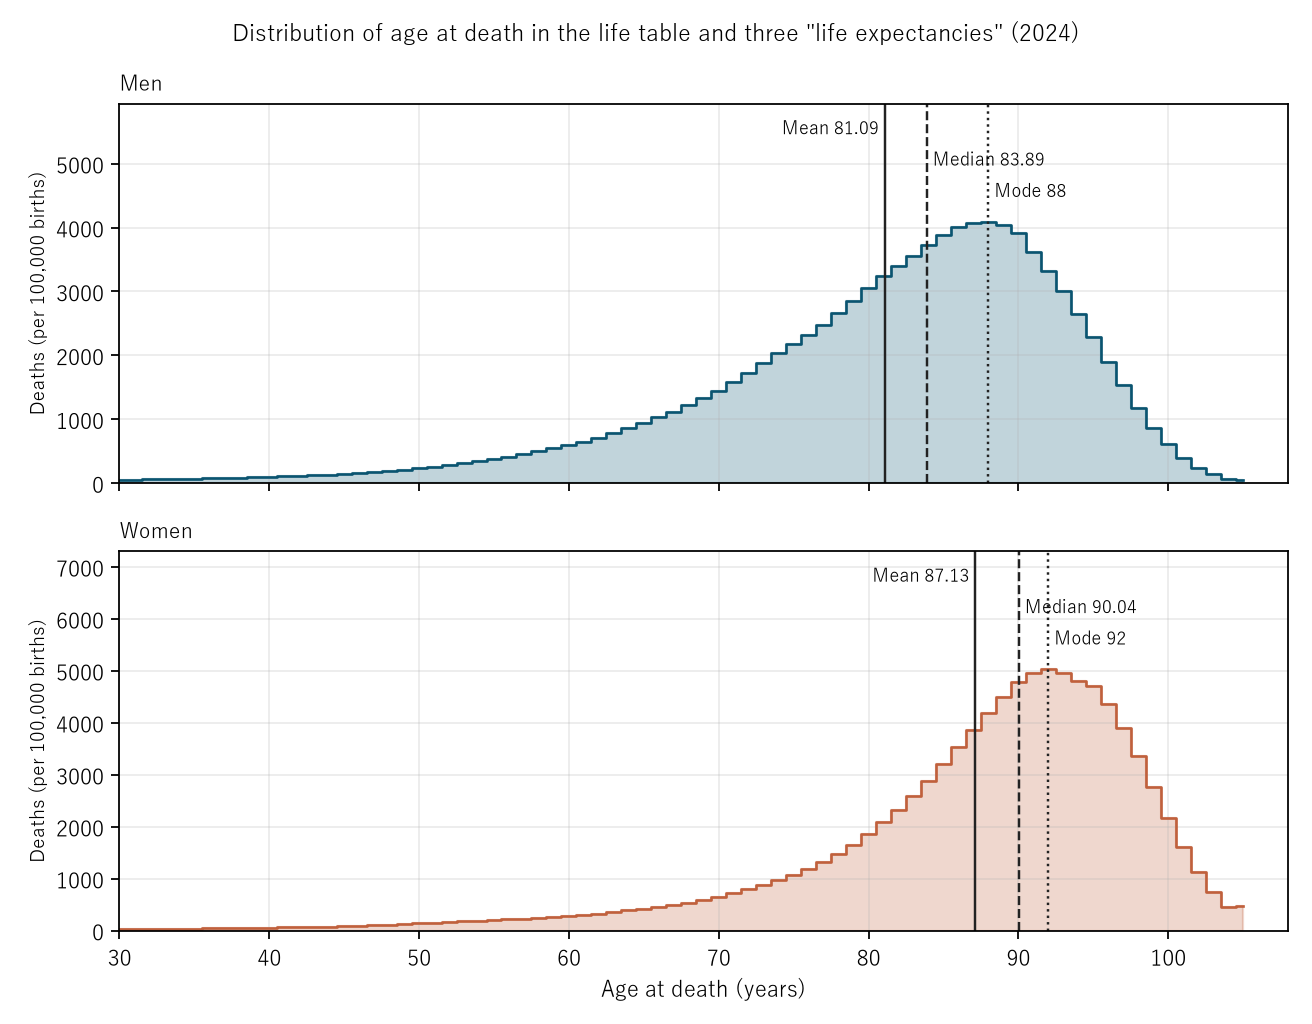
Figure 1: Life-table deaths by single year of age (per 100,000 births), 2024. Solid line: mean; dashed: median; dotted: mode. A long tail trails to the left of the peak.
5. Core — young deaths move the three separately
Calculation 5.1 The three rebuilt for those reaching a given age, and how far each moved (years)
| Sex | Reaching | Mean | Median | Mode | Share dying before that age |
|---|---|---|---|---|---|
| Men | 1 | 81.24 (+0.15) | 83.91 (+0.03) | 88 (+0) | 0.0018 |
| Men | 50 | 82.57 (+1.48) | 84.30 (+0.42) | 88 (+0) | 0.0306 |
| Men | 65 | 84.47 (+3.38) | 85.27 (+1.38) | 88 (+0) | 0.1036 |
| Women | 1 | 87.28 (+0.15) | 90.05 (+0.02) | 92 (+0) | 0.0018 |
| Women | 50 | 88.24 (+1.11) | 90.24 (+0.21) | 92 (+0) | 0.0199 |
| Women | 65 | 89.38 (+2.25) | 90.63 (+0.59) | 92 (+0) | 0.0564 |
Observation 5.2: Removing young deaths moves the mean most, the median by less than half as much, and the mode not at all. Restricted to men reaching 65, the mean rises by 3.38 years, the median by 1.38, and the mode stays at 88.
Observation 5.3: The mean adds up every age at death, so for each young death even "how young" counts. For the median, only that young deaths lie left of the middle counts. The mode depends only on where the peak is, so however deaths left of the peak change, it does not move.
6. From 1947 to 2024
Calculation 6.1 First and last years of Table 4
| Sex | 1947: median, mean, gap | 2024: median, mean, gap | Gain: mean, median |
|---|---|---|---|
| Men | 59.28, 50.06, 9.22 | 83.89, 81.09, 2.79 | +31.03, +24.61 |
| Women | 64.45, 53.96, 10.49 | 90.04, 87.13, 2.91 | +33.17, +25.59 |
Observation 6.2: Life expectancy rose more than the median lifespan (gain in mean ÷ gain in median: 1.261 for men, 1.296 for women). Fewer young deaths pushed the mean up a lot and the median a little — the same direction as Section 5.
Observation 6.3: The gap first fell below 3.5 years in 1980 for men and 1975 for women, and since 1990 it has stayed within 2.79–3.21 years (men) and 2.80–2.91 (women). Once young deaths became few, the mean and median moved side by side at a nearly constant gap.
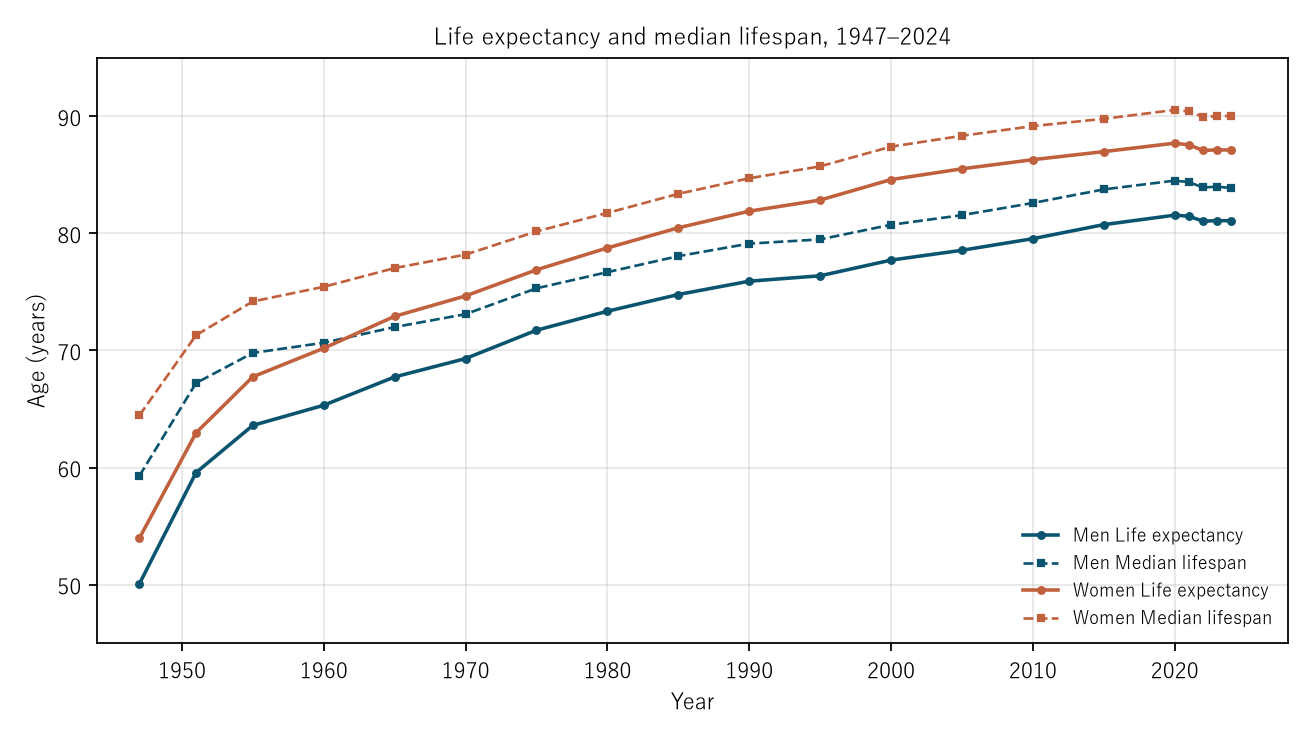
Figure 2: Solid lines: life expectancy; dashed: median lifespan (navy men, vermilion women). The space between the lines narrows sharply over the first dozen or so years, then stays nearly constant.
7. Limitations
- These are period figures, assuming each year's mortality stays fixed, not years actually lived by a generation (M003).
- The mode is the largest single-year death count, and the peak is flat. Sub-year intervals at age 0 are not used.
- The mode's trend over time is not treated.
- In Table 4, values up to Reiwa 2 come from complete life tables, and values up to Showa 45 exclude Okinawa (table notes).
- It is not one person's outlook.
Conclusion
In the 2024 life table, men's life expectancy was 81.09, the median lifespan 83.89, and the most common age at death 88 (women: 87.13, 90.04, 92). Restricted to those reaching 65, men's mean rose by 3.38 years, the median by 1.38, and the mode did not move. Since 1947, the mean has risen more than the median, and their gap shrank from 9.22 to 2.79 years (men).
One thing separates them — how much weight young deaths carry.
When you hear "life expectancy", remember that it is the mean age at death, and that the age half of people live to (the median lifespan) lies about 3 years above it.
Data and reproduction
| Data | Ministry of Health, Labour and Welfare, "Abridged Life Tables for 2024", Tables 1 and 2 (retrieved from e-Stat); overview of the 2024 abridged life tables, figure data Table 4 and "2. Survival in the life table, including median lifespan" (Ministry website https://www.mhlw.go.jp/toukei/saikin/hw/life/life24/index.html ) (accessed 25–26 September 2026) |
| Terms of use | e-Stat content follows the Public Data License (Version 2.0) and the Ministry website follows its Public Data License (Version 1.0) (both allow processing with attribution). The reproduced median, mode and restricted summaries were produced by processing these and are not figures produced by the government |
| Scope | Japan, by sex, 2024 (1947–2024 over time) |
| Verification | 検算/M012.py (--zu also writes the figures). Every number in the text is taken from 検算/M012_output.txt |
| Raw data | The 4 retrieved files and SOURCES.md (URLs, retrieval dates, SHA-256, terms of use, copy of the overview text) in data/ |
| Figures | 図/M012_zu1, 図/M012_zu2 (png, svg, English versions) |
References
- Ministry of Health, Labour and Welfare. Abridged Life Tables for 2024, Table 1 and Table 2 (in Japanese). e-Stat (accessed 25 September 2026). https://www.e-stat.go.jp/
- Ministry of Health, Labour and Welfare. Overview of the 2024 Abridged Life Tables, figure data, Table 4: median lifespan and life expectancy over time (in Japanese; accessed 26 September 2026). https://www.mhlw.go.jp/toukei/saikin/hw/life/life24/xls/life24-13.xlsx
- Yamagishi, Y. (2026). Life Expectancy Is Not the Number of Years Anyone Actually Lives [M003]. Zenodo. https://doi.org/10.5281/zenodo.22963485
Reference
Yamagishi, Y. (2026). "Life Expectancy" Is Neither the Middle Age at Death nor the Most Common One [M012]. Zenodo.
DOI: 10.5281/zenodo.22966555
YOI: https://www.yamagishiyuuki.com/yoi/M012
ORCID: 0009-0006-8587-3450
PDF (English) · PDF (Japanese) · Date proof of the English PDF (OpenTimestamps .ots) · SHA256SUMS
The record page for this paper (in Japanese, with the PDFs in each language and the date proof): YOI M012. This paper is a preprint and has not been peer reviewed.