Abstract
This paper asks from which ages the "rise in life expectancy" came — the answer is young ages at first and old ages now. From the Ministry's overview tables (share surviving to given ages and life expectancy at main ages over time), the change in life expectancy between neighbouring years from 1947 to 2024 was split into contributions by age group (0–39, 40–64, 65–74, 75–89, 90+) using Arriaga's decomposition. No new mathematical theorem or new law is claimed.
First, in every interval the contributions sum to the change in life expectancy (Arriaga's identity; largest discrepancy 1.2e-14). Decomposing the overview's rounded values differs from decomposing the unrounded life-table values by at most 0.007 years per group for 2020→2024 (Sections 3 and 7).
Second, this is the core of the paper. Of men's 9.51-year gain from 1947 to 1951, 7.63 years (0.802) came from fewer deaths under 40. Of the 0.81-year gain from 2015 to 2020, 0.50 years (0.614) came from ages 65 and over. For women, 0.813 and 0.837 (Section 4).
Third, ages 65 and over first contributed more than ages under 40 in the 1970–1975 interval, for both sexes. Ages 75 and over first did so in 1985–1990 for men and 1975–1980 for women (Section 5).
Fourth, in 2021–2022, when life expectancy fell (men −0.42 years, women −0.48), over 60% of the fall (0.688 and 0.754) came from ages 75 and over (Section 5).
Fifth, the split depends on whether one compares once or adds step by step. Comparing 1947 and 2024 once, the under-40 share of men's 31.03-year gain is 0.668; adding the intervals gives 0.564. Both sum to the same 31.03 years (Section 6).
Sixth, the separator is at which ages deaths fell. The same "one year gained" was filled by young lives just after the war and by old lives today.
Scope note: No new mathematical theorem or new law is claimed — Arriaga's decomposition is a known method; this paper applies it to published tables and measures when the age content switched. This paper is a structural interpretation describing the shape of numbers in public aggregate data; it is not medical advice, diagnosis, or a treatment recommendation. The author is not a physician. For decisions about individual health, consult a physician or medical institution. It is a preprint that has not been peer reviewed. It is not one person's outlook — all figures are period life-table figures (M003). It does not go into why deaths fell at those ages (medicine, hygiene, living conditions). The age groups are coarse — cut at 0, 40, 65, 75 and 90, the ages available in the overview tables. About the data: the Ministry website's figure data are used under its Public Data License (Version 1.0) and the e-Stat life tables under the Public Data License (Version 2.0); the decomposition was produced by processing them. Source: Ministry of Health, Labour and Welfare, overview of the 2024 abridged life tables, abridged and complete life tables. What this paper adds is decomposing 19 intervals from 1947 to 2024 with the same age groups and identifying, by sex, when ages 65+ overtook ages under 40; showing that comparing once versus adding step by step reallocates the gain across ages; and checking the decomposition of rounded overview values against life-table values.
1. Notation and question
- Arriaga's decomposition: splits the difference between two years' life expectancies into contributions by age group. The contribution of group [x, y) is the change in years lived within the group (direct effect) plus the years lived above it by people who no longer die in it (indirect effect); the contributions sum exactly to the difference.
- Here, for each year, survivors l (age 0 = 100) and the cumulative stationary population T = l × life expectancy are built at the group boundaries (ages 0, 40, 65, 75, 90).
Question: From which ages did the rise in life expectancy come, and when did that switch?
Observation 1.1: A gain in life expectancy is one number, but its content is the sum of "at which ages people no longer died". The same one-year gain can have different ages inside it in different eras.
2. Preliminary look and design
Stated honestly: the design of this paper was decided after looking at the tables.
| Content | |
|---|---|
| Survival shares | Overview Table 3: share surviving to 40, 65, 75, 90 (1947–2024; 0.1% units) |
| Life expectancy | Overview Reference 2: life expectancy at 0, 40, 65, 75, 90 (0.01-year units) |
| Years | The 20 years of Table 3: 1947, 1950–52 (taken as 1951), every 5 years from 1955 to 2020, and 2021–2024 (19 intervals) |
| Check | Repeat the decomposition for 2020 (23rd complete life table) and 2024 (abridged) with life-table values |
3. Data and their verification
Calculation 3.1 The retrieved files were fixed by SHA-256, and the following were checked.
| What was checked | Result |
|---|---|
| Whether Reference 2 has life expectancies for every Table 3 year | Yes (20 years) |
| Overview values vs life-table values for 2020 and 2024 | Largest difference 0.047 points in survival share, 0.000 years in life expectancy (rounding) |
| Whether contributions sum to the change in every interval | Yes (largest discrepancy 1.2e-14) |
4. Core — young ages at first, old ages now
Calculation 4.1 Change in life expectancy between neighbouring years and contributions by age group (men, years)
| Interval | Change | 0–39 | 40–64 | 65–74 | 75–89 | 90+ |
|---|---|---|---|---|---|---|
| 1947→1951 | +9.51 | +7.63 | +1.41 | +0.36 | +0.12 | +0.00 |
| 1951→1955 | +4.03 | +3.05 | +0.72 | +0.19 | +0.07 | +0.00 |
| 1955→1960 | +1.72 | +1.57 | +0.27 | +0.00 | -0.12 | -0.00 |
| 1960→1965 | +2.42 | +1.78 | +0.47 | +0.16 | +0.01 | -0.00 |
| 1965→1970 | +1.57 | +0.69 | +0.45 | +0.22 | +0.20 | +0.00 |
| 1970→1975 | +2.42 | +0.80 | +0.74 | +0.57 | +0.30 | +0.01 |
| 1975→1980 | +1.62 | +0.56 | +0.41 | +0.40 | +0.24 | +0.01 |
| 1980→1985 | +1.43 | +0.36 | +0.30 | +0.43 | +0.32 | +0.01 |
| 1985→1990 | +1.14 | +0.22 | +0.35 | +0.22 | +0.32 | +0.02 |
| 1990→1995 | +0.46 | +0.09 | +0.15 | +0.02 | +0.19 | +0.01 |
| 1995→2000 | +1.34 | +0.20 | +0.25 | +0.28 | +0.53 | +0.07 |
| 2000→2005 | +0.84 | +0.13 | +0.21 | +0.29 | +0.20 | +0.01 |
| 2005→2010 | +0.99 | +0.14 | +0.33 | +0.26 | +0.26 | +0.01 |
| 2010→2015 | +1.20 | +0.18 | +0.44 | +0.16 | +0.40 | +0.02 |
| 2015→2020 | +0.81 | +0.09 | +0.22 | +0.12 | +0.33 | +0.05 |
| 2020→2021 | -0.09 | +0.01 | +0.01 | -0.02 | -0.06 | -0.03 |
| 2021→2022 | -0.42 | +0.00 | -0.05 | -0.08 | -0.22 | -0.07 |
| 2022→2023 | +0.04 | -0.05 | +0.02 | +0.00 | +0.05 | +0.02 |
| 2023→2024 | +0.00 | +0.03 | +0.02 | -0.01 | -0.05 | +0.01 |
Observation 4.2: Of men's 9.51-year gain from 1947 to 1951, 7.63 years (0.802) came from fewer deaths under 40. For women, 7.32 of 9.01 years (0.813).
Observation 4.3: Of men's 0.81-year gain from 2015 to 2020, 0.50 years (0.614) came from ages 65 and over, and 0.09 from under 40. For women, 0.60 of 0.72 years (0.837) came from 65 and over.
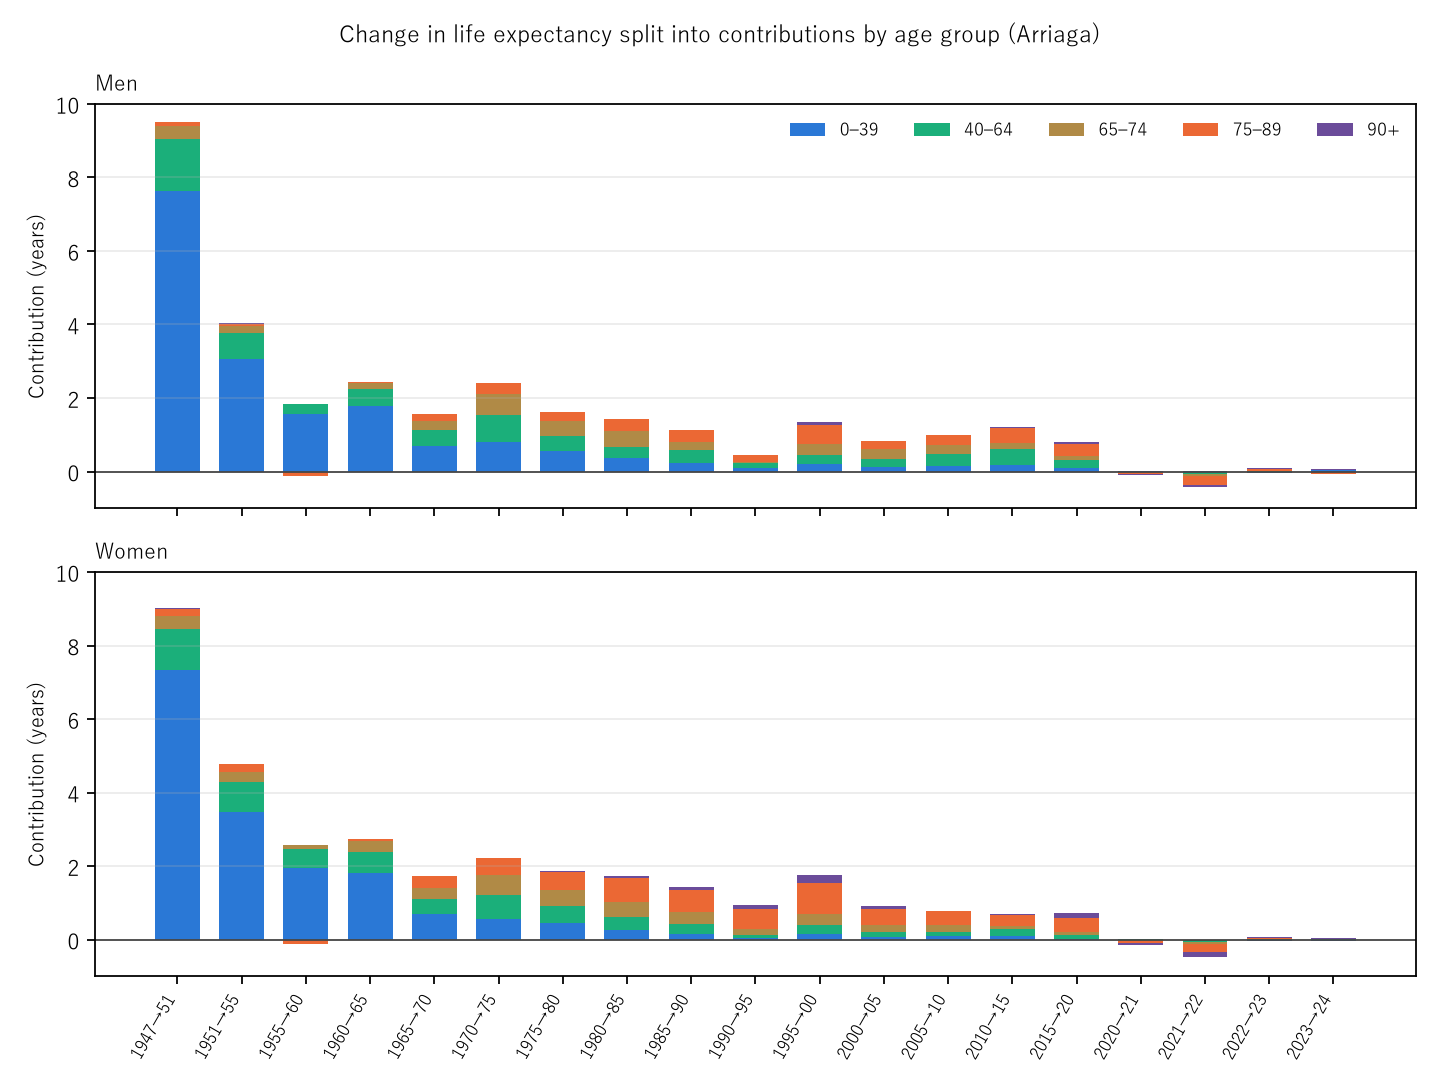
Figure 1: Contributions stacked for each of the 19 intervals (top men, bottom women). Blue under 40, green 40–64, brown 65–74, orange 75–89, purple 90+. Bar height is the change in life expectancy.
5. When the switch came
Observation 5.1: Ages 65+ first contributed more than ages under 40 in 1970–1975, for both sexes (men +0.88 vs +0.80; women +1.01 vs +0.55). Ages 75+ first did so in 1985–1990 for men (+0.34 vs +0.22) and 1975–1980 for women (+0.52 vs +0.45).
Observation 5.2: Life expectancy fell in 2020–2021 (−0.09) and 2021–2022 (−0.42) for men, and in 2020–2021 (−0.14), 2021–2022 (−0.48) and 2023–2024 (−0.01) for women. Over 60% of the 2021–2022 fall (0.688 and 0.754) came from ages 75+. Falls, like gains, now sit at old ages.
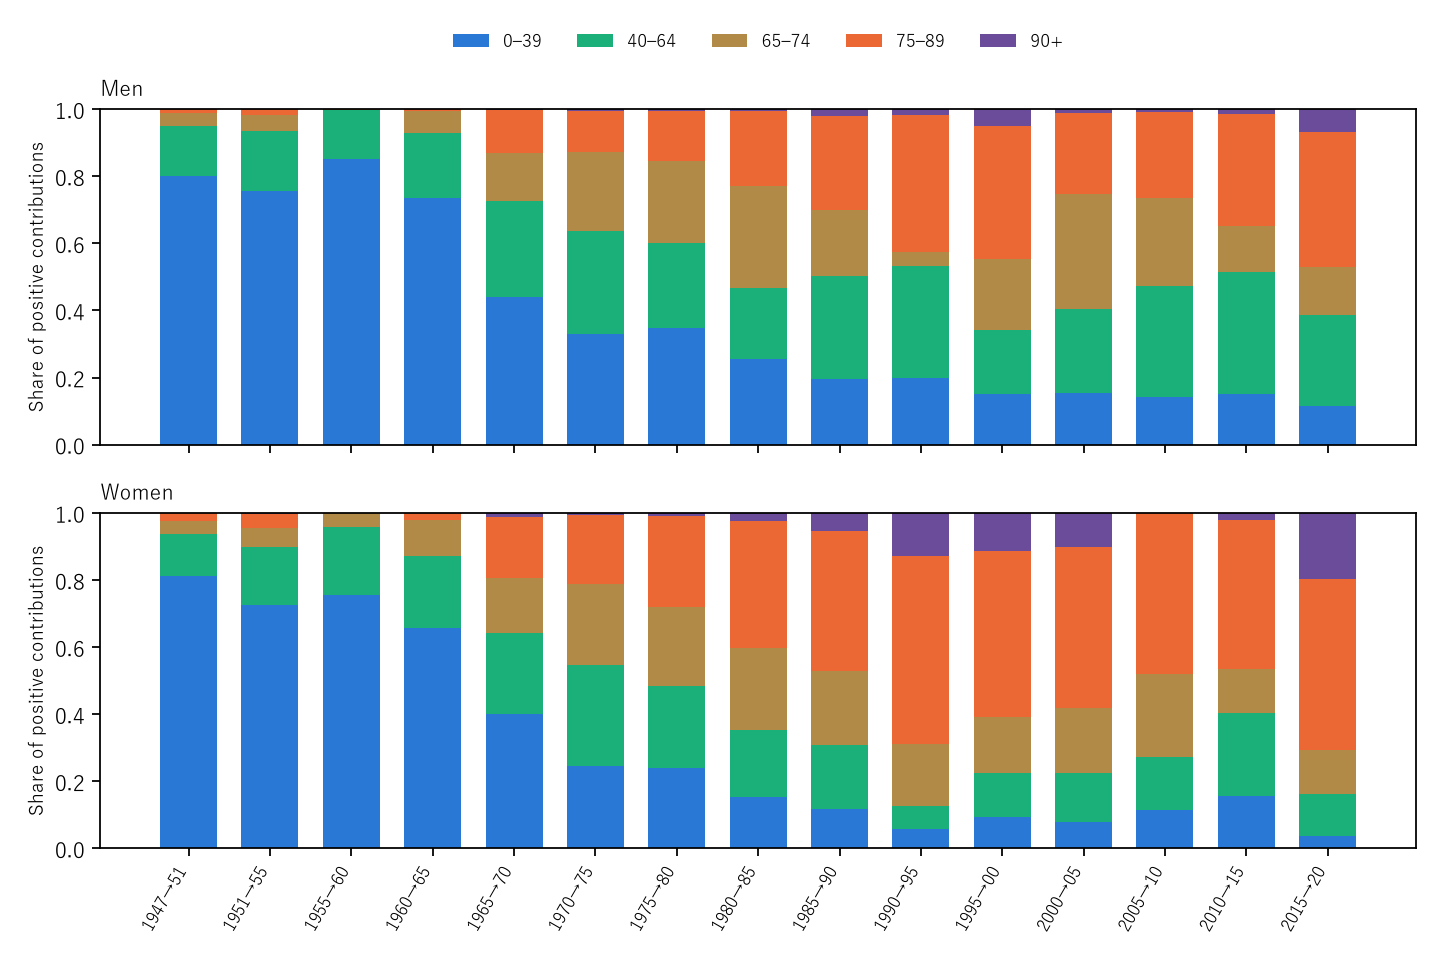
Figure 2: For the 15 intervals from 1947 to 2020, each group's share of the positive contributions. Blue (under 40) shrinks and orange (75–89) grows. After 2020 the changes are tiny, so shares are not drawn.
6. Comparing once, or adding step by step
Calculation 6.1 Contributions by age group to the 1947→2024 gain (men 31.03 years, women 33.17)
| Sex | Method | 0–39 | 40–64 | 65–74 | 75–89 | 90+ | Under-40 share |
|---|---|---|---|---|---|---|---|
| Men | Compare once | +20.73 | +6.60 | +2.60 | +1.09 | +0.02 | 0.668 |
| Men | Add steps | +17.50 | +6.72 | +3.59 | +3.08 | +0.15 | 0.564 |
| Women | Compare once | +20.77 | +6.43 | +3.44 | +2.47 | +0.06 | 0.626 |
| Women | Add steps | +17.08 | +6.02 | +3.99 | +5.48 | +0.59 | 0.515 |
Observation 6.2: For the same 77-year gain, comparing once gives a larger under-40 share, and adding steps gives larger old-age shares. A one-shot comparison weights by 1947 survivors (few reached old ages), so old-age contributions come out small; adding steps weights by the survivors at the start of each interval. The sums are identical. The answer of a decomposition depends on which years one chooses to compare.
7. Rounded and unrounded values
Calculation 7.1 Decomposition of 2020→2024 (years)
| Sex | Values used | 0–39 | 40–64 | 65–74 | 75–89 | 90+ | Sum |
|---|---|---|---|---|---|---|---|
| Men | Life table | -0.007 | -0.016 | -0.096 | -0.289 | -0.061 | -0.469 |
| Men | Overview | -0.008 | -0.014 | -0.099 | -0.288 | -0.062 | -0.470 |
| Women | Life table | -0.101 | -0.019 | -0.058 | -0.251 | -0.158 | -0.587 |
| Women | Overview | -0.095 | -0.012 | -0.058 | -0.258 | -0.158 | -0.580 |
Observation 7.2: Decomposing the overview's rounded values (survival 0.1%, life expectancy 0.01 years) differs from decomposing life-table values by at most 0.007 years per group. The interval contributions can be read to two decimals.
8. Limitations
- These are period figures.
- The age groups are coarse; infants are not separated from ages 1–39.
- Why deaths fell at those ages is not examined.
- Intervals differ in length (4–5 years early on, 1 year after 2020); keep this in mind when comparing sizes.
- In Table 3, values up to Reiwa 2 come from complete life tables, and values up to Showa 45 exclude Okinawa (table notes).
- It is not one person's outlook.
Conclusion
Of men's 9.51-year gain in life expectancy from 1947 to 1951, 0.802 came from fewer deaths under 40, but of the 0.81-year gain from 2015 to 2020, 0.614 came from ages 65 and over. Ages 65+ first outweighed ages under 40 in 1970–1975 for both sexes. The 2021–2022 fall, too, came over 60% from ages 75+. And for the same 77-year gain, the under-40 share was 0.668 or 0.564 depending on whether years were compared once or added step by step.
One thing separates them — at which ages deaths fell.
When you hear "life expectancy rose", ask at which ages people stopped dying to make up that gain. The same one year held different ages just after the war and today.
Data and reproduction
| Data | Ministry of Health, Labour and Welfare, overview of the 2024 abridged life tables, figure data Table 3 and Reference 2 (Ministry website https://www.mhlw.go.jp/toukei/saikin/hw/life/life24/index.html ); "Abridged Life Tables for 2024" Tables 1 and 2 and "The 23rd Life Tables (complete)" Tables 1 and 2 (e-Stat) (accessed 25–26 September 2026) |
| Terms of use | The Ministry website follows its Public Data License (Version 1.0) and e-Stat the Public Data License (Version 2.0). The decomposition was produced by processing these and is not a figure produced by the government |
| Scope | Japan, by sex, 1947–2024, five age groups |
| Verification | 検算/M013.py (--zu also writes the figures). Every number in the text is taken from 検算/M013_output.txt |
| Raw data | The 5 retrieved files and SOURCES.md (URLs, retrieval dates, SHA-256, terms of use, the decomposition formula) in data/ |
| Figures | 図/M013_zu1, 図/M013_zu2 (png, svg, English versions) |
References
- Ministry of Health, Labour and Welfare. Overview of the 2024 Abridged Life Tables, figure data, Table 3 and Reference 2 (in Japanese; accessed 26 September 2026). https://www.mhlw.go.jp/toukei/saikin/hw/life/life24/xls/life24-13.xlsx
- Ministry of Health, Labour and Welfare. Abridged Life Tables for 2024, Table 1 and Table 2; The 23rd Life Tables (complete), Table 1 and Table 2 (in Japanese). e-Stat (accessed 25 September 2026). https://www.e-stat.go.jp/
- Yamagishi, Y. (2026). Life Expectancy Is Not the Number of Years Anyone Actually Lives [M003]. Zenodo. https://doi.org/10.5281/zenodo.22963485
Reference
Yamagishi, Y. (2026). Gains in Life Expectancy Came First from Fewer Deaths at Young Ages, Now from Fewer at Old Ages [M013]. Zenodo.
DOI: 10.5281/zenodo.22966888
YOI: https://www.yamagishiyuuki.com/yoi/M013
ORCID: 0009-0006-8587-3450
PDF (English) · PDF (Japanese) · Date proof of the English PDF (OpenTimestamps .ots) · SHA256SUMS
The record page for this paper (in Japanese, with the PDFs in each language and the date proof): YOI M013. This paper is a preprint and has not been peer reviewed.