Abstract
This paper asks whether, as life expectancy rises, the spread of ages at death narrows along with it — the answer is that it barely narrows; the whole distribution shifts right. A survival curve turning square (most people living to similar ages and dying around then) is called "rectangularization". Using single-year deaths from the complete life tables (six rounds, 1995–2020) and the 2024 abridged life tables, the mean and the spread were compared over the same periods. No new mathematical theorem or new law is claimed.
First, in all 14 tables (7 years × 2 sexes), deaths sum to within 6 of the 100,000 births, and the mean derived from deaths matches the tabulated life expectancy within 0.007 years (Section 3).
Second, this is the core of the paper. From 1995 to 2020, life expectancy rose by 5.18 years for men and 4.86 for women, but the standard deviation of age at death above 10 (S10) shrank by only 0.43 and 0.40 years. The shrinkage is 0.083 times the rise, the same for both sexes (Section 4).
Third, the age at which survivors fall to 75% moved more than the age at which they fall to 25% (men 5.40 vs 4.55 years; women 5.39 vs 4.22), so the interquartile range shrank by 0.85 years for men and 1.17 for women. The early-dying side caught up a little, but the distribution kept nearly its width and moved right (Section 4).
Fourth, the mean and the spread do not move together. In 1995–2000, life expectancy rose and S10 grew for both sexes (men +1.34 and +0.27 years). In 2020–2024, men's life expectancy fell by 0.47 years and S10 also shrank by 0.20 (Section 5).
Fifth, for men in 2024 the 75% age is 75.16 and the 25% age 90.20: the middle half die somewhere within 15.04 years. For women, 82.96 to 95.14, a range of 12.18 years (Section 4).
Sixth, the separator is whether the mean moved or the spread moved. The single phrase "people live longer" can refer to two quantities: where the distribution sits and how wide it is. Over these 25 years, it is mostly the former that moved.
Scope note: No new mathematical theorem or new law is claimed — the mean and spread of the age-at-death distribution are known quantities computable from life tables, and rectangularization of the survival curve has been discussed in demography. This paper only sets the rise in the mean and the narrowing of the spread side by side, on the same yardstick, for Japan's 1995–2024 life tables. This paper is a structural interpretation describing the shape of numbers in public aggregate data; it is not medical advice, diagnosis, or a treatment recommendation. The author is not a physician. For decisions about individual health, consult a physician or medical institution. It is a preprint that has not been peer reviewed. It is not one person's outlook — all figures are period life-table figures (M003). It does not discuss whether lifespan has an upper limit, nor why the spread did not narrow. About the data: the e-Stat life tables were processed under the Public Data License (Version 2.0). Source: Ministry of Health, Labour and Welfare, complete and abridged life tables. What this paper adds is computing the mean, SD, S10 and interquartile range for 7 life tables from 1995 to 2024 in the same way, and showing that the narrowing of the spread was only 0.083 times the rise in the mean for both sexes, and showing intervals in which the mean and the spread did not move together.
1. Notation and question
- Distribution of age at death: life-table deaths by single year of age (per 100,000 births). Age at death is taken as the middle of the year (x + 0.5), except the last age, taken as x + its life expectancy.
- Standard deviation: the spread of ages at death. S10 is the SD among deaths at 10 and over (a common form that removes the effect of infant and child deaths).
- Interquartile range: the age at which survivors fall to 25% of births minus the age at which they fall to 75%; the range within which the middle half die.
- Rectangularization: the survival curve approaching a rectangle, i.e., the spread narrowing.
Question: As life expectancy rises, does the spread of ages at death narrow too? How do the rise in the mean and the narrowing of the spread compare?
Observation 1.1: Life expectancy rises whether the survival curve shifts right (everyone living longer together) or squares off (the spread narrowing). Life expectancy alone does not tell which happened.
2. Preliminary look and design
Stated honestly: the design of this paper was decided after looking at the tables.
| Content | |
|---|---|
| Life tables | Complete life tables, 18th (1995), 19th (2000), 20th (2005), 21st (2010), 22nd (2015), 23rd (2020), and the 2024 abridged life tables; by sex, single years |
| Mean | Life expectancy (tabulated) and the mean derived from deaths (cross-check) |
| Spread | SD, S10, interquartile range |
| Comparison | Rise in mean versus narrowing of spread over 1995→2020 (complete tables) and 2020→2024 |
3. Data and their verification
Calculation 3.1 The retrieved files were fixed by SHA-256, and the following were checked.
| What was checked | Result |
|---|---|
| Sum of deaths vs 100,000 births | Largest difference 6 across the 14 tables |
| Mean from deaths vs tabulated life expectancy | Largest difference 0.007 years |
| Last age in the table | 110–116 in the 1995–2020 complete tables; 105 in the 2024 abridged table (105 and over combined) |
4. Core — the mean rose, the spread barely narrowed
Calculation 4.1 Life expectancy and the spread of age at death (years)
| Year | Sex | Life expectancy | SD | S10 | 75% age | 25% age | IQR |
|---|---|---|---|---|---|---|---|
| 1995 | Men | 76.38 | 14.96 | 13.54 | 70.11 | 86.22 | 16.11 |
| 2000 | Men | 77.72 | 14.89 | 13.81 | 71.20 | 87.65 | 16.46 |
| 2005 | Men | 78.56 | 14.68 | 13.71 | 72.35 | 88.35 | 16.00 |
| 2010 | Men | 79.55 | 14.32 | 13.51 | 73.57 | 89.04 | 15.47 |
| 2015 | Men | 80.75 | 13.89 | 13.14 | 74.80 | 89.96 | 15.16 |
| 2020 | Men | 81.56 | 13.74 | 13.11 | 75.51 | 90.77 | 15.26 |
| 2024 | Men | 81.09 | 13.58 | 12.91 | 75.16 | 90.20 | 15.04 |
| 1995 | Women | 82.85 | 13.86 | 12.37 | 78.12 | 91.37 | 13.25 |
| 2000 | Women | 84.60 | 13.69 | 12.52 | 79.79 | 93.13 | 13.34 |
| 2005 | Women | 85.52 | 13.53 | 12.51 | 80.83 | 93.98 | 13.16 |
| 2010 | Women | 86.30 | 13.17 | 12.26 | 81.86 | 94.51 | 12.65 |
| 2015 | Women | 86.99 | 12.75 | 11.92 | 82.76 | 94.89 | 12.13 |
| 2020 | Women | 87.71 | 12.70 | 11.97 | 83.51 | 95.58 | 12.08 |
| 2024 | Women | 87.13 | 12.82 | 12.00 | 82.96 | 95.14 | 12.18 |
Calculation 4.2 Changes from 1995 to 2020 (years)
| Sex | Life expectancy | SD | S10 | 75% age | 25% age | IQR | S10 change ÷ LE rise |
|---|---|---|---|---|---|---|---|
| Men | +5.18 | -1.22 | -0.43 | +5.40 | +4.55 | -0.85 | -0.083 |
| Women | +4.86 | -1.17 | -0.40 | +5.39 | +4.22 | -1.17 | -0.083 |
Observation 4.3: While men's life expectancy rose by 5.18 years, S10 shrank by only 0.43. The shrinkage is 0.083 times the rise, and the same 0.083 for women. The overall SD shrank by 1.22 and 1.17 years, but most of that is fewer deaths at young ages; above 10 the narrowing is small.
Observation 4.4: The 75% age moved more than the 25% age (1.187 times for men, 1.278 for women). The early-dying side caught up somewhat, and the IQR shrank by 0.85 years (men) and 1.17 (women). Even so, the IQR in 2024 is still 15.04 years for men and 12.18 for women: the distribution kept nearly its width and moved right.
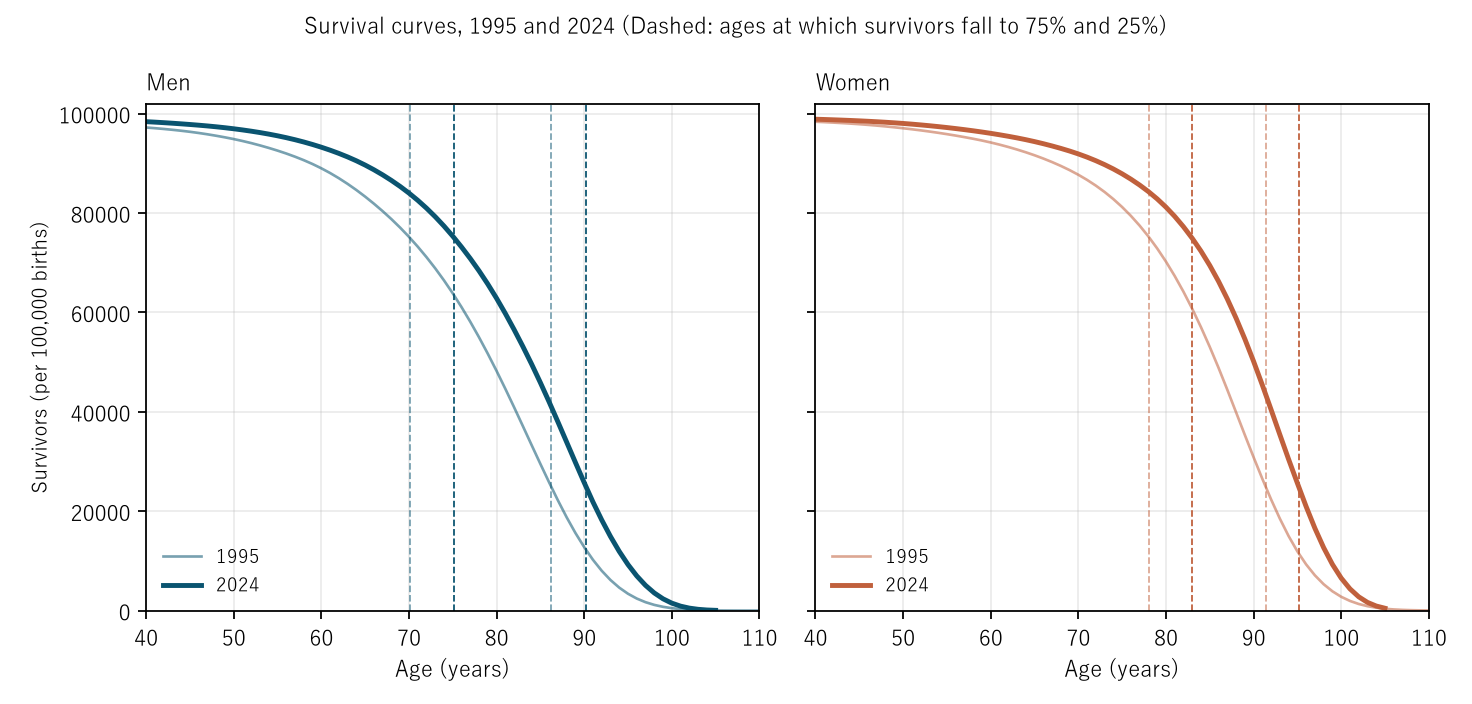
Figure 1: Survival curves for 1995 (thin) and 2024 (thick). Dashed lines mark the ages at which survivors fall to 75% and 25%. The curve moves right with little change in shape.
5. The mean and the spread do not move together
Calculation 5.1 Change in life expectancy and in S10 by interval (years)
| Interval | Men | Women |
|---|---|---|
| 1995→2000 | (+1.34, +0.27) | (+1.75, +0.15) |
| 2000→2005 | (+0.84, -0.10) | (+0.92, -0.01) |
| 2005→2010 | (+0.99, -0.21) | (+0.78, -0.24) |
| 2010→2015 | (+1.20, -0.37) | (+0.69, -0.34) |
| 2015→2020 | (+0.81, -0.03) | (+0.72, +0.05) |
| 2020→2024 | (-0.47, -0.20) | (-0.58, +0.03) |
Observation 5.2: In 1995–2000, life expectancy rose and S10 also grew for both sexes. In 2020–2024, men's life expectancy fell by 0.47 years while S10 shrank by 0.20. They do not line up on a single "longer mean, narrower spread" relationship.
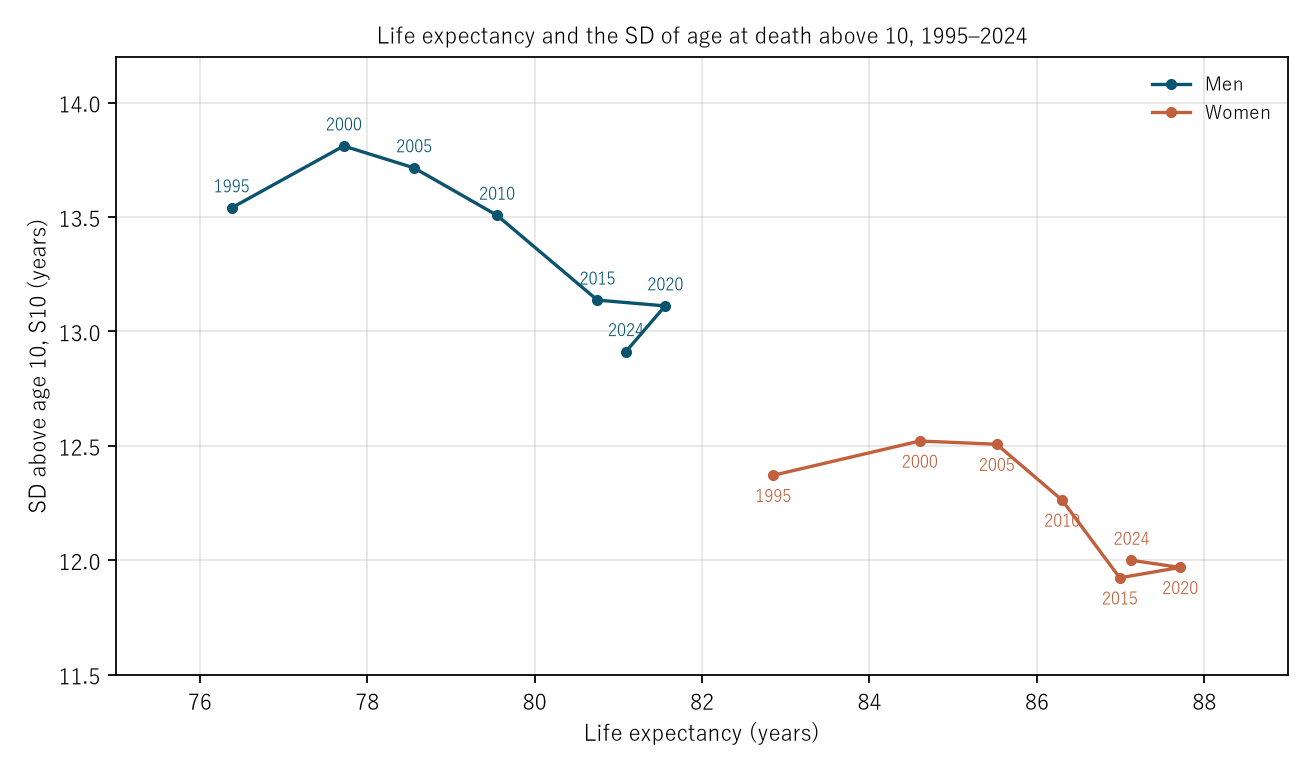
Figure 2: Life expectancy (horizontal) against S10 (vertical) for the 7 life tables from 1995 to 2024 (navy men, vermilion women). The points move far to the right while dropping only a little.
6. Limitations
- These are period figures, not the spread of an actual generation's lifespans (M003).
- Age at death is set at the middle of each year, and the last age is treated in this paper's own way.
- The last age differs by year (2024 combines 105 and over); the treatment of the oldest tail can move the SD slightly.
- Years before 1995 are not treated (e-Stat's complete life tables are in Excel only from the 18th round). Earlier eras presumably saw large narrowing from falling young deaths, but this paper did not measure it.
- Why the spread did not narrow, and whether lifespan has a limit, are not examined.
- It is not one person's outlook.
Conclusion
From 1995 to 2020, life expectancy rose by 5.18 years for men and 4.86 for women. Meanwhile the SD of age at death above 10 shrank by only 0.43 and 0.40 years, 0.083 times the rise. The IQR narrowed a little but was still 15.04 years for men and 12.18 for women in 2024. The mean and the spread did not move together: there were intervals where the mean rose and the spread widened, and where the mean fell and the spread narrowed.
One thing separates them — whether the mean moved or the spread moved.
When you hear "people live longer", ask whether the distribution moved or narrowed. In Japan over these 25 years, it mostly moved.
Data and reproduction
| Data | Ministry of Health, Labour and Welfare, complete life tables, 18th (1995) to 23rd (2020), and the "Abridged Life Tables for 2024", by sex (retrieved from e-Stat; accessed 25–26 September 2026) |
| Terms of use | e-Stat content follows the Public Data License (Version 2.0) of the Government of Japan (compatible with CC BY 4.0). The SDs and IQRs were produced by processing these and are not figures produced by the government |
| Scope | Japan, by sex, 7 life tables from 1995 to 2024 |
| Verification | 検算/M014.py (--zu also writes the figures). Every number in the text is taken from 検算/M014_output.txt |
| Raw data | The 13 retrieved files and SOURCES.md (URLs, retrieval dates, SHA-256, how the tables were read) in data/ |
| Figures | 図/M014_zu1, 図/M014_zu2 (png, svg, English versions) |
References
- Ministry of Health, Labour and Welfare. The 18th Life Tables, Tables 1–4; the 19th–23rd Life Tables, Table 1 and Table 2; Abridged Life Tables for 2024, Table 1 and Table 2 (in Japanese). e-Stat (accessed 25 September 2026). https://www.e-stat.go.jp/
- Yamagishi, Y. (2026). Life Expectancy Is Not the Number of Years Anyone Actually Lives [M003]. Zenodo. https://doi.org/10.5281/zenodo.22963485
Reference
Yamagishi, Y. (2026). As Life Expectancy Rose, the Spread of Ages at Death Barely Narrowed [M014]. Zenodo.
DOI: 10.5281/zenodo.22966972
YOI: https://www.yamagishiyuuki.com/yoi/M014
ORCID: 0009-0006-8587-3450
PDF (English) · PDF (Japanese) · Date proof of the English PDF (OpenTimestamps .ots) · SHA256SUMS
The record page for this paper (in Japanese, with the PDFs in each language and the date proof): YOI M014. This paper is a preprint and has not been peer reviewed.