Abstract
This paper asks how many deaths in cause-of-death statistics have an ill-defined cause, and how this differs by place of death and age. From the 2024 Vital Statistics tables (short list of causes × place of death; three-character causes × five-year age), the short-list category "other symptoms, signs and abnormal clinical and laboratory findings, not elsewhere classified" (ICD-10 R00–R99 excluding old age and sudden infant death syndrome) was counted as "deaths with an ill-defined cause". No new mathematical theorem or new law is claimed.
First, in 2024 there were 40,293 deaths with an ill-defined cause, 0.0251 of all deaths (men 0.0315, women 0.0184). Of these, 0.648 were R99 "other ill-defined and unspecified causes of mortality". The two tables agree with each other (Section 3).
Second, this is the core of the paper. The share of ill-defined deaths is 0.0940 among deaths at home and 0.0115 among deaths in hospital: 8.19 times higher at home. Home accounts for 0.613 of ill-defined deaths but only 0.164 of all deaths. Among men dying at home it is 0.1184 (Section 4).
Third, by age, among ages 15 and over the share is highest at 55–59 (0.0633), falls steadily at older ages, and is 0.0065 at 100 and over (Section 5).
Fourth, at old ages, the share of "old age" rises in place of ill-defined deaths. The old-age share rises with age from 0.0016 at 60–64 to 0.4779 at 100+, first exceeding the ill-defined share (0.0232) at 80–84 (0.0692). By place, the old-age share is highest in nursing homes (0.4190) and lowest in hospitals (0.0618) (Sections 4 and 5).
Fifth, the pattern of places of death moves. The share dying at home fell from 0.217 in 1990 to 0.122 in 2005 and is 0.164 in 2024; nursing homes rose from 0.021 in 2005 to 0.122 in 2024 (Section 6).
Sixth, the separator is place of death and age. How causes are written in cause-of-death statistics differs by where and at what age people die.
Scope note: No new mathematical theorem or new law is claimed — the cause classification and place of death are in published tables; this paper lines them up and measures where the share of ill-defined deaths is high. This paper is a structural interpretation describing the shape of numbers in public aggregate data; it is not medical advice, diagnosis, or a treatment recommendation. The author is not a physician. For decisions about individual health, consult a physician or medical institution. It is a preprint that has not been peer reviewed. It is not one person's outlook — all figures are national aggregate shares. It does not examine how procedures for determining the cause differ by place of death, and so does not go into the reasons for the differences. It says nothing about how any individual death was handled or about the work of any place or profession. "Ill-defined cause" means the underlying cause on the death record was classified to R00–R99 (excluding old age and sudden infant death syndrome); old age is counted separately. Cells with fewer than 10 deaths are not shown (there are 0 among the cells shown here). About the data: the e-Stat Vital Statistics are used under the Public Data License (Version 2.0); this paper's shares were produced by processing them. Source: Ministry of Health, Labour and Welfare, Vital Statistics. What this paper adds is lining up the share of ill-defined deaths by place of death and five-year age, showing the home–hospital difference and the middle-age peak, showing the age at which old age overtakes ill-defined deaths, and checking that the two tables agree. "The share of deaths that undergo autopsy", which the inventory suggested could be combined here, is not included because the table could not be found.
1. Notation and question
- Deaths with an ill-defined cause: short-list category "18300 other symptoms, signs and abnormal clinical and laboratory findings, not elsewhere classified", corresponding to ICD-10 R00–R99 excluding R54 (old age) and R95 (sudden infant death syndrome).
- Old age: short-list category "18100 old age (senility)" (R54).
- Place of death: as recorded on the death record (hospital, clinic, long-term care facility, midwifery home, nursing home, home, other).
- Share: among deaths in a place (or age group), the share with an ill-defined cause (or old age).
Question: How many deaths have an ill-defined cause, and how does this differ by place of death and age?
Observation 1.1: Cause-of-death statistics classify and count the underlying cause written on the death record. Deaths whose underlying cause cannot be written clearly enter no disease category and fall into the "symptoms and signs" chapter. Where that share is high shows where cause-of-death statistics are hard to see.
2. Survey and design
To be candid: the design was decided after looking at the tables.
| Content | |
|---|---|
| Place | Volume 3, Table 5: short list of causes × sex × place of death (2024) |
| Age | Volume 3, Table 1-1: three-character causes × sex × five-year age (2024); the R00–R99 three-character categories summed excluding R54 and R95 |
| Trend | Volume 1, Table 5.5: deaths by place of death over years |
| Not included | Tables by autopsy or surgery (stored statistical tables), which were not found in the list of e-Stat final-data tables used here |
3. Data and checks
Calculation 3.1 The retrieved files were fixed by SHA-256, and the following were checked.
| Check | Result |
|---|---|
| Volume 3, Table 5 | Places sum to the total; men + women = total (all deaths, old age, ill-defined deaths) |
| Agreement of the two tables | Table 1-1's R00–R99 (88 categories excluding R54 and R95) sum to Table 5's 18300 (total 40293, men 25838, women 14455) |
| Old age | Table 1-1's R54 = Table 5's 18100 |
| Trend table | Table 5.5's 2024 total, hospital and home = the all-deaths row of Table 5 |
Calculation 3.2 Numbers for 2024
| Deaths | |
|---|---|
| All deaths | 1,605,378 |
| "Symptoms and signs" chapter | 247,238 |
| of which old age | 206,887 |
| of which sudden infant death syndrome | 58 |
| of which ill-defined cause | 40,293 (0.0251 of deaths) |
| Most common three-character categories among ill-defined deaths | R99 26,116 (0.648), R98 4,995, R68 2,529 |
4. Core — place of death
Calculation 4.1 Deaths and shares by place of death (2024)
| Place | Deaths | Ill-defined | Share | Old age | Share |
|---|---|---|---|---|---|
| Hospital | 1,033,675 | 11,859 | 0.0115 | 63,851 | 0.0618 |
| Clinic | 19,148 | 166 | 0.0087 | 2,915 | 0.1522 |
| Long-term care facility | 66,131 | 415 | 0.0063 | 22,143 | 0.3348 |
| Nursing home | 196,003 | 1,240 | 0.0063 | 82,122 | 0.4190 |
| Home | 262,883 | 24,709 | 0.0940 | 32,046 | 0.1219 |
| Other | 27,538 | 1,904 | 0.0691 | 3,810 | 0.1384 |
Observation 4.2: The share of ill-defined deaths is 0.0940 at home and 0.0115 in hospital: 8.19 times higher at home. It is also high in "other" places (0.0691) and low in facilities (0.0063 in long-term care facilities and nursing homes).
Observation 4.3: Home accounts for 0.613 of ill-defined deaths but only 0.164 of all deaths. For men the home share is 0.1184 and for women 0.0631, while in hospital it is almost the same for both (0.0114 and 0.0116).
Observation 4.4: The old-age share is high in nursing homes (0.4190) and long-term care facilities (0.3348) and lowest in hospitals (0.0618). How causes are written differs by where people die.
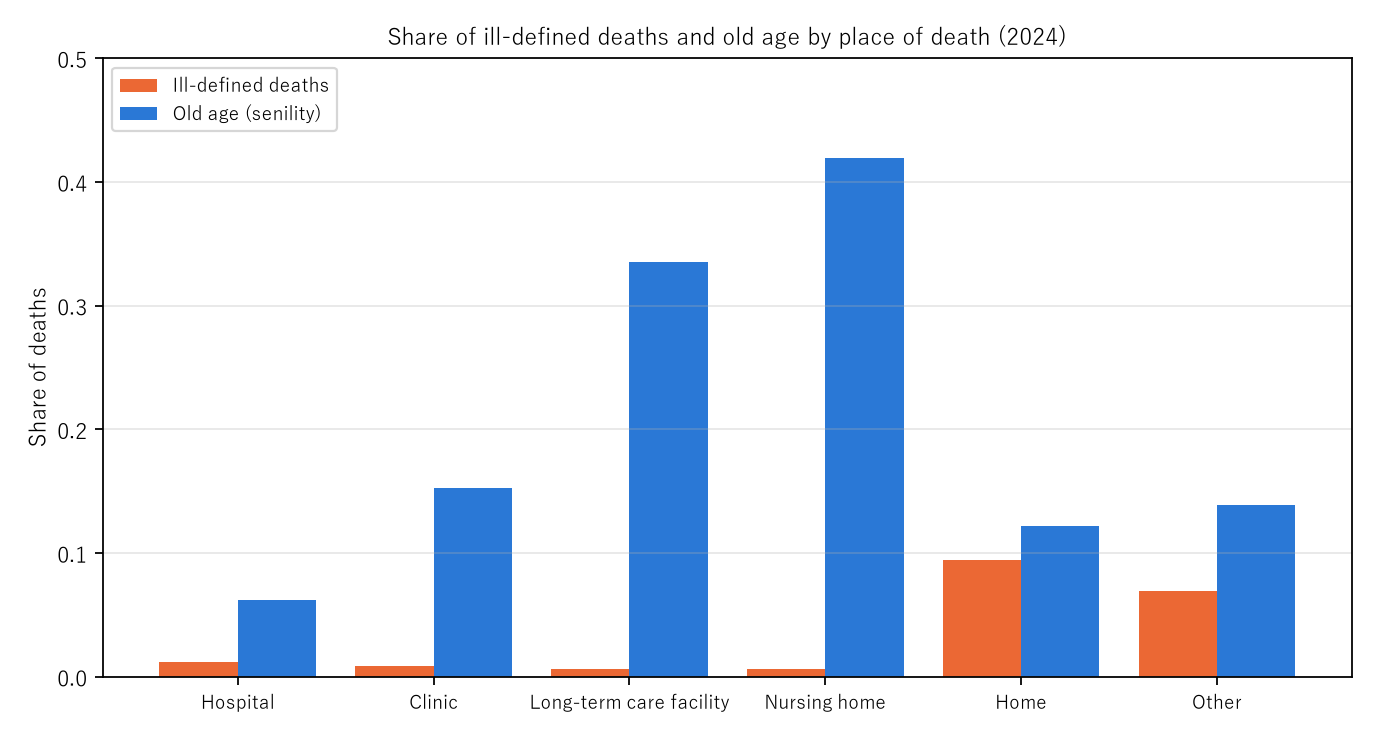
Figure 1: Shares by place of death in 2024. Red, ill-defined deaths; blue, old age. Red is high at home and in "other" places; blue is high in nursing homes and long-term care facilities.
5. Age
Calculation 5.1 Shares by age (2024, five-year groups)
| Age | Ill-defined share | Old-age share |
|---|---|---|
| 40–44 | 0.0576 | — |
| 55–59 | 0.0633 | — |
| 60–64 | 0.0577 | 0.0016 |
| 70–74 | 0.0423 | 0.0146 |
| 75–79 | 0.0327 | 0.0292 |
| 80–84 | 0.0232 | 0.0692 |
| 85–89 | 0.0179 | 0.1279 |
| 90–94 | 0.0126 | 0.2175 |
| 95–99 | 0.0095 | 0.3244 |
| 100+ | 0.0065 | 0.4779 |
("—" marks groups with fewer than 10 old-age deaths, which are not shown.)
Observation 5.2: Among ages 15 and over, the ill-defined share is highest at 55–59 (0.0633; 1,899 ÷ 29,979), falls steadily at older ages, and is 0.0065 at 100+. At ages 0–4 it is high at 0.0908 (162 ÷ 1,785).
Observation 5.3: The old-age share rises with age from 0.0016 at 60–64 to 0.4779 at 100+, first exceeding the ill-defined share at 80–84 (0.0692 against 0.0232). Ill-defined and old age combined are 0.0576 at 40–44, 0.0633 at 55–59, 0.0569 at 70–74, 0.1458 at 85–89 and 0.4844 at 100+. At old ages, within the "symptoms and signs" chapter the underlying cause is more often written as old age.
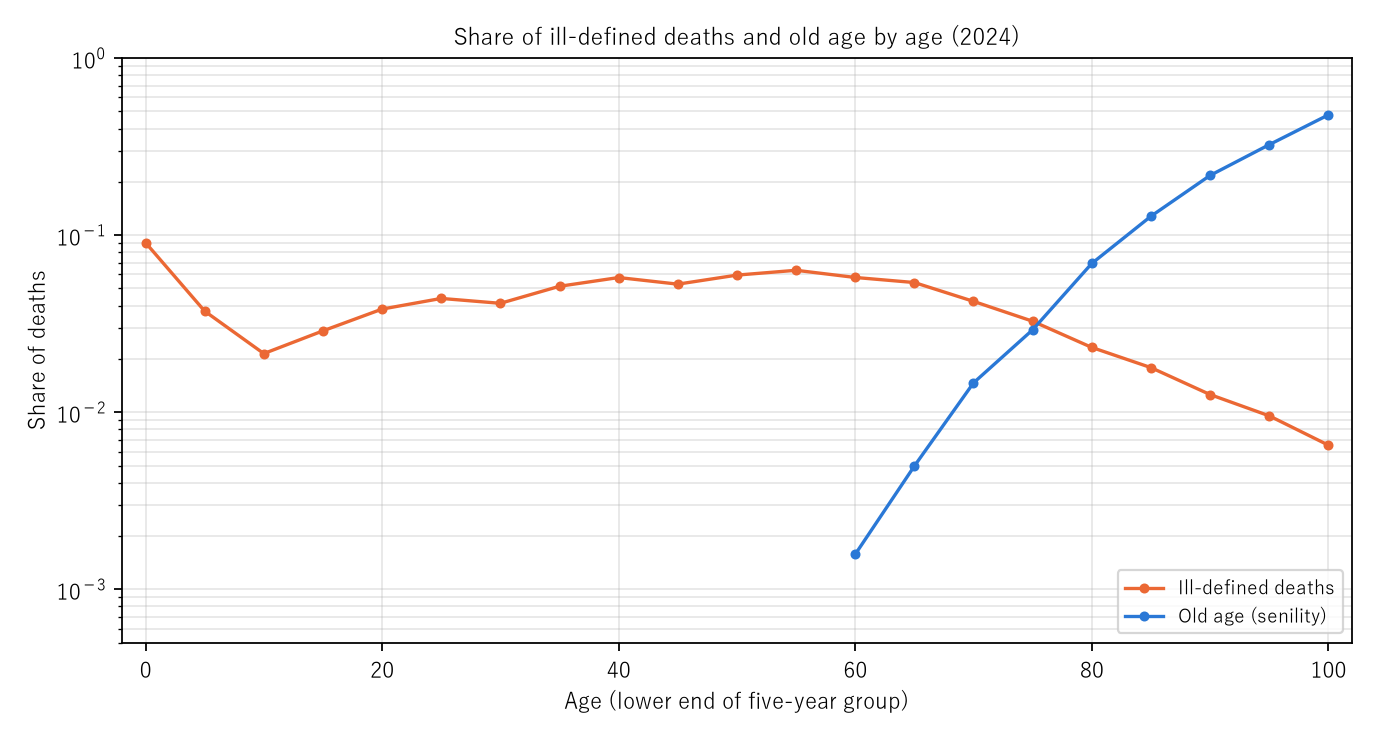
Figure 2: Shares by five-year age in 2024 (logarithmic scale). Red, ill-defined deaths; blue, old age (only groups with 10 or more deaths). Red is high in middle age and falls at old ages; blue rises from 60 and passes red around 80.
6. Places of death over time
Calculation 6.1 Shares by place of death (Table 5.5)
| Year | All deaths | Hospital | Nursing home | Home | Other |
|---|---|---|---|---|---|
| 1990 | 820,305 | 0.716 | 0.000 | 0.217 | 0.033 |
| 2005 | 1,083,796 | 0.798 | 0.021 | 0.122 | 0.025 |
| 2024 | 1,605,378 | 0.644 | 0.122 | 0.164 | 0.017 |
Observation 6.2: The share dying at home fell from 0.217 in 1990 to 0.122 in 2005 and is 0.164 in 2024; nursing homes rose from 0.021 in 2005 to 0.122 in 2024 (as the table notes, deaths in nursing homes up to 1994 are included in home or other). Because how causes are written differs by place, a shift in the pattern of places of death can move the size of "ill-defined" and "old age" in cause-of-death statistics. This paper looks at 2024 only and makes no comparison across years.
7. Limitations
- Only 2024 was examined; the trend in the ill-defined share was not studied.
- How procedures for determining the cause differ by place of death was not examined; the reasons for the differences are not discussed.
- "Ill-defined cause" is a classification definition. Old age was counted separately, but as an underlying cause it also belongs to the symptoms-and-signs chapter.
- Autopsy was not included (the table could not be found).
- Nothing is said about individual deaths or about any place or profession.
- It is not one person's outlook.
Conclusion
In 2024, 40,293 deaths had an ill-defined cause, 0.0251 of all deaths. The share at home was 0.0940, 8.19 times that in hospital, and 0.613 of ill-defined deaths occurred at home, which accounts for only 0.164 of all deaths. By age the share peaked at 55–59 (0.0633) and fell at older ages, and from 80–84 the old-age share exceeded it.
Two things separate them — place of death and age.
When reading cause-of-death statistics, remember that how causes are written differs by where and at what age the death occurred.
Data and reproduction
| Data | Ministry of Health, Labour and Welfare, Vital Statistics 2024 (final data), Volume 3, Tables 5 and 1-1, and Volume 1, Table 5.5 (e-Stat, accessed 26 September 2026) |
| Terms of use | e-Stat follows the Public Data License (Version 2.0). This paper's shares were produced by processing these and are not figures produced by the government |
| Scope | Japan, 2024 (places of death over time: 1990, 2005, 2024) |
| Verification | 検算/M022.py (--zu also writes the figures). Every number in the text is taken from 検算/M022_output.txt |
| Raw data | The 3 retrieved files and SOURCES.md (URLs, retrieval dates, SHA-256, terms of use, definitions and calculation) in data/ |
| Figures | 図/M022_zu1, 図/M022_zu2 (png, svg, English versions) |
References
- Ministry of Health, Labour and Welfare. Vital Statistics 2024 (final data), Volume 3, Tables 5 and 1-1, and Volume 1, Table 5.5 (in Japanese). e-Stat (accessed 26 September 2026). https://www.e-stat.go.jp/
Reference
Yamagishi, Y. (2026). The Share of Deaths with an Ill-Defined Cause Is 8.19 Times Higher at Home Than in Hospital, and Peaks at Ages 55–59 [M022]. Zenodo.
DOI: 10.5281/zenodo.22968281
YOI: https://www.yamagishiyuuki.com/yoi/M022
ORCID: 0009-0006-8587-3450
PDF (English) · PDF (Japanese) · Date proof of the English PDF (OpenTimestamps .ots) · SHA256SUMS
The record page for this paper (in Japanese, with the PDFs in each language and the date proof): YOI M022. This paper is a preprint and has not been peer reviewed.