Abstract
This paper asks how many years before the report the people behind a reported "5-year survival" figure were diagnosed. Using two tables based on population-based cancer registries — 5-year relative survival by year of diagnosis (diagnosed 1993–2011) and figures built only from follow-up in 2002–2006 (period analysis) — it counts, from the definitions, the years a figure refers to, and measures, site by site, how far the figures moved over a span of the same length. It claims no new mathematical theorem and no new law.
First, the newest cohort figures in the tables (people diagnosed in 2009–2011) come from the "Survival 2009-2011 Report" of 2020. The five years of the last person diagnosed are complete at the end of 2016, and from the diagnosis midpoint 2010.5 to the 2020 report is 9.5 years (9 to 11 years counted from the years of diagnosis) (Section 4).
Second, the period figures (follow-up in 2002–2006) draw on people diagnosed in 1997–2006. Survival in the first year comes from diagnoses in 2001–2006, and in the fifth year from diagnoses in 1997–2002. At the end of 2006, the newest year of diagnosis with five complete years is 2001, so the period figure includes diagnoses five years newer than the completed cohort — this follows from the definitions. The paper that carried those figures is from 2014, 9.5 years after the window midpoint 2004.5 (Section 4).
Third, this is the core of the paper. Over a span as long as the 9.5 years before the report (diagnosed 1993–96 to diagnosed 2003–05, almost the same areas), the 5-year relative survival of 35 site-by-sex groups moved from −6.2 points for bladder, female, to +27.0 points for prostate, male (median +2.3 points). Eighteen groups rose by more than two standard errors, 2 fell by more than two, and 15 stayed within two. Prostate went from 66.8 to 93.8 and lung, female, from 27.1 to 41.0 (Section 5).
Fourth, an old figure is not necessarily a lower one. Bladder fell, male 80.0 to 76.5 and female 70.6 to 64.4. Over the following 9.0 years (2000–02 to 2009–11, with the areas widening from 6 to 22 prefectures), the only groups falling by more than two standard errors were again bladder, male and female, while 29 rose. The paper does not go into why they fell (Section 5).
Fifth, the period figures are set beside the cohort figures for the same 6 prefectures. The period figure was above the 2000–02 cohort in only 8 of 32 groups, with a median difference of −1.0 points and a rank correlation of −0.140 with the speed of change. The two tables differ in age range and exclusion rules, so this difference does not measure the effect of the period method. Only for prostate, which moved the most, is the period figure 87.4 above all three cohorts diagnosed in 1993–2002 (66.8, 75.5, 84.6) and below the 93.8 of 2003–05 (Section 6).
Sixth, what separates the two is whether people are grouped by the year of diagnosis (cohort) or by the year of follow-up (period). A cohort figure cannot be made until five years are complete, and by the time it is reported nearly ten years have passed since diagnosis. How many points that delay amounts to differs by site, and it does not always point the same way.
Scope note: This paper claims no new mathematical theorem and no new law — the difference between the cohort method and the period method is known, and the tables and the cited papers explain it themselves. The paper only lays out the published figures, counts from the definitions the years a figure refers to, and measures how far the figures moved over a span of the same length. It does not recompute any survival. This paper is a structural interpretation of the shape of numbers in published aggregate data, and is not medical advice, diagnosis, or a treatment recommendation. The author is not a physician. For decisions about individual health, consult a physician or medical institution. It is a preprint that has not been peer reviewed. It is not a forecast for someone diagnosed today — every figure aggregates people diagnosed in, or followed in, certain years (as in M003 and M006). It does not say how the figures will move from here — what it measured is the movement over past spans of the same length. It does not go into why the figures moved (changes in diagnosis, treatment, registration, and so on). It does not compare prefectures, areas, or facilities — the covered areas differ by year (6, 7, 21, and 22 prefectures), and the paper cannot separate that difference. About the data: the figures in the tables are shown unaltered, kept apart from this paper's calculations (differences, midpoint years, multiples of standard errors, rank correlation). Source: National Cancer Center Japan, Cancer Information Service. What the paper adds: counting from the definitions the years of diagnosis a reported figure refers to, showing, beside their standard errors, how far and in which direction 35 groups moved over a span as long as the delay before the report, and setting the period figures beside the cohort figures and showing that, because the two tables differ, the effect of the period method cannot be measured here.
1. Notation and question
- 5-year relative survival: the share alive five years after diagnosis, divided by the survival of general people of the same sex and age (%). As the tables' glossary puts it, it shows the probability of survival as a percentage of that of the general population.
- Cohort figure: a figure built by following people diagnosed in certain years for five years (the sheet "推移データ(性別)", trends by sex).
- Period figure: a figure built only from the survival experience of people followed in certain years (period analysis; the "0-year survivor" row for ages 15–99 of the sheet on conditional 5-year survival). A 0-year survivor is someone alive 0 years after diagnosis, that is, everyone diagnosed, so this is 5-year relative survival from diagnosis (conditional survival is built on the same idea as the figures M006 used from hospital-based registries).
- Diagnosis midpoint: diagnoses in years a to b have midpoint (a + b + 1) ÷ 2 (1993–1996 → 1995.0, 2009–2011 → 2010.5).
- Point: the unit of a difference in survival (%).
Question: how many years before the report were the people behind a reported 5-year survival figure diagnosed? How far do the figures move during that delay?
Observation 1.1: A 5-year survival figure cannot be made until five years are complete. After that, there are further years before it is reported (Calculation 4.1). So a reported figure is not a figure for the people of the reporting year. M003 showed, for life expectancy, that the period figure (built from one year's death rates) and the cohort figure (what people born in one year actually lived) are different numbers. This paper counts that distinction for cancer survival.
2. Survey and design
Stated honestly: the design was set after seeing the tables, and reworked once after the survey.
| Content | |
|---|---|
| Cohort figures | Table cancer_survival(1993-2011).xls, sheet "推移データ(性別)": 5-year relative survival by site and sex for diagnoses in 1993-1996, 1997-1999, 2000-2002, 2003-2005, 2006-2008, and 2009-2011 (with numbers of people and standard errors) |
| Period figures | Table cancer_survival_period(2002-2006).xls, sheets on conditional 5-year survival and 10-year survival by age: data from 6 prefectures followed in 2002–2006 (period analysis) |
| Expectation and what missed | Before the survey the expectation was "the period figure will sit on the newer side of the cohort figures for the same areas." Laid side by side, it did not (Section 6). Because the two tables differ in age range and exclusion rules, this comparison turned out not to measure the effect; so the core was rebuilt around "the years a figure refers to" and "the movement over a span of the same length" |
3. Data and checks
Calculation 3.1 The 2 retrieved files were fixed by SHA-256, and the following was checked.
- The 2009-2011 values of the trend sheet equal those of the separate sheet of the latest data by sex, in all 54 site-sex groups.
- Within the period figures, 10-year relative survival = 0-year survivors' 5-year × 5-year survivors' 5-year ÷ 100 holds in all 40 groups aged 15–99, within the width explained by the rounding of the three values to one decimal (at most 0.147 points). Because relative survival chains by multiplication, this checks that "0-year survivors' 5-year" is 5-year relative survival from diagnosis. The 10-year value is lower than the 0-year survivors' 5-year value in every group.
- From the tables' "file contents" sheets, the year of the Survival 2009-2011 Report (2020) and the year of the paper cited for the period figures (Ito et al., Cancer Science; 2014) were read. The note on the period figures says the data were diagnosed in 1993–2006 and followed in 2002–2006, using the period method. For the trend data (the cohort figures), the tables cite the Survival 2009-2011 Report and Matsuda et al. (2011).
- The covered areas were read from the text of the tables: 1993-2002 6 prefectures, 2003-2005 7, 2006-2008 21, 2009-2011 22 (the stated number equals the number of names listed in each). The 6 prefectures of the period figures are the same set as the 6 prefectures of the cohorts diagnosed in 1993-2002, and the 7 prefectures of 2003-2005 are those 6 plus Shiga.
Calculation 3.2 How the two tables differ (from the tables' notes)
| Cohort figures | Period figures | |
|---|---|---|
| Areas | 6 prefectures for diagnoses in 1993–2002, 7 for 2003–05, 21 for 2006–08, 22 for 2009–11 | 6 prefectures (the same 6 as the cohorts diagnosed in 1993–2002) |
| Age | Excludes unknown age and 100 and over | 15–99 (ages 0–14 and 15–29 are separate rows) |
| Exclusions (as written in the notes) | DCO, second and later cancers, non-malignant, in situ cancers (including mucosal colorectal cancers), unknown age and 100 and over, and trace-back patients | DCO, second and later cancers, non-malignant, in situ cancers (except brain tumors), and unknown age and 100 and over |
Observation 3.3: Leukemia is not compared. The period figures for leukemia are 25.5 for males and 26.5 for females aged 15–99, and 79.6 for ages 0–14 (both sexes), 53.1 points apart. A figure that moves this much depending on whether age is cut at 15 is not compared across two tables that cut age differently.
4. The years a figure refers to
Calculation 4.1 Reported figures and the years they refer to (arithmetic of the definitions)
| Cohort figure (newest) | Period figure | |
|---|---|---|
| People behind the figure | People diagnosed in 2009–2011 | People followed in 2002–2006 |
| Years of diagnosis that count | 2009–2011 (midpoint 2010.5) | 1997–2006 |
| Five years complete | For the last person, at the end of 2016 | Can be made at the end of the window (end of 2006) |
| Year of the source | 2020 (Survival 2009-2011 Report) | 2014 (Ito et al.) |
| Midpoint to source | 9.5 years (9 to 11 years from the years of diagnosis) | 9.5 years (from the window midpoint 2004.5) |
Calculation 4.2 Years of diagnosis behind each year of the period figure (window 2002–2006)
| Year since diagnosis | Years of diagnosis that count | Midpoint of those years |
|---|---|---|
| Year 1 (0–1) | 2001–2006 | 2004.0 |
| Year 2 (1–2) | 2000–2005 | 2003.0 |
| Year 3 (2–3) | 1999–2004 | 2002.0 |
| Year 4 (3–4) | 1998–2003 | 2001.0 |
| Year 5 (4–5) | 1997–2002 | 2000.0 |
Observation 4.3: The newest cohort figure describes people diagnosed 9.5 years (at the midpoint) before the report. Completing five years takes until the end of 2016 even for the last person diagnosed. After that come further years before the 2020 report.
Observation 4.4: The period figure uses only the survival experience inside the follow-up window. Diagnoses from different years count for each year since diagnosis, and the average of the five midpoints is 2002.0. At the end of 2006, the newest year of diagnosis with five complete years is 2001, but the period figure includes diagnoses up to 2006 — at the same moment, diagnoses five years newer are included. Even so, the paper carrying these period figures is from 2014, 9.5 years after the window midpoint. The period method makes the figure newer by definition, but in this example the time to the report was 9.5 years with the period method too.
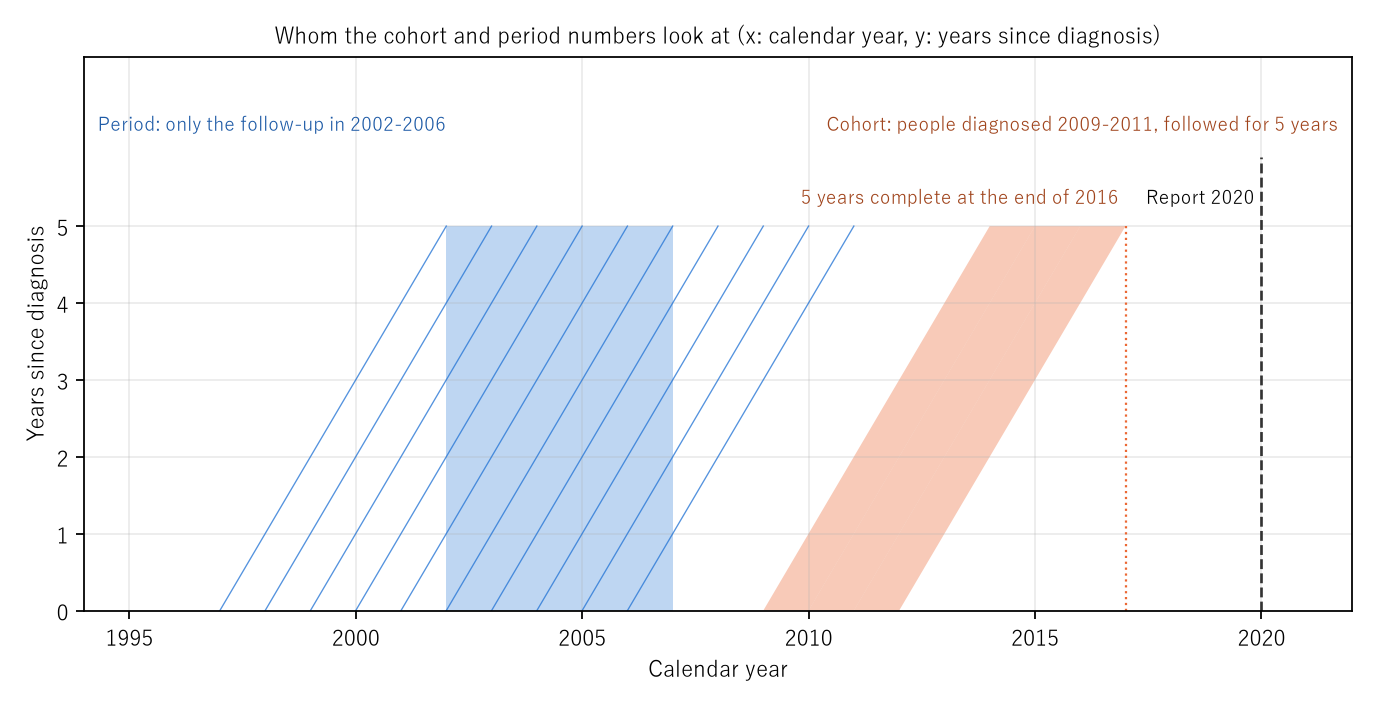
Figure 1: The horizontal axis is the calendar year and the vertical axis the years since diagnosis. The orange band is the people diagnosed in 2009–2011 (the cohort figure); it moves diagonally through five years and is complete at the end of 2016. The dashed line is the 2020 report. The blue box is the follow-up window 2002–2006 (the period figure), and the diagonal lines are the people diagnosed in each year from 1997 to 2006. The period figure uses only the parts that pass through the window.
5. Core — the movement over the same 9.5 years
How far did the cohort figures move over a span as long as the 9.5 years before the report? Diagnoses in 1993–96 (midpoint 1995.0) and in 2003–05 (midpoint 2004.5) are exactly 9.5 years apart. The covered areas are 6 and 7 prefectures, almost the same. A second pair, diagnoses in 2000–02 and 2009–11 (9.0 years; 6 and 22 prefectures), is shown alongside.
Calculation 5.1 5-year relative survival (%) of 35 site-by-sex groups and their differences (points). "SE×" is the difference divided by the square root of the sum of the two squared standard errors (all sites, uterus — the row combining cervix and corpus — and both sexes combined are not counted). Sorted by the 1993–96 difference, smallest first.
| Site, sex | 1993–96 | 2003–05 | Difference | SE× | People | 2000–02 | 2009–11 | Difference | SE× |
|---|---|---|---|---|---|---|---|---|---|
| Bladder, F | 70.6 | 64.4 | −6.2 | −2.4 | 1,049 / 1,118 | 68.2 | 63.0 | −5.2 | −2.3 |
| Oral cavity/pharynx, F | 64.7 | 60.2 | −4.5 | −1.9 | 1,022 / 1,061 | 60.6 | 69.4 | +8.8 | +4.2 |
| Bladder, M | 80.0 | 76.5 | −3.5 | −2.5 | 3,481 / 3,480 | 79.9 | 76.5 | −3.4 | −2.7 |
| Larynx, M | 78.2 | 76.0 | −2.2 | −1.0 | 1,570 / 1,286 | 76.8 | 81.8 | +5.0 | +2.6 |
| Larynx, F | 75.9 | 74.6 | −1.3 | −0.2 | 90 / 82 | 90.2 | 81.7 | −8.5 | −1.5 |
| Cervix, F | 73.4 | 72.2 | −1.2 | −1.0 | 3,472 / 2,928 | 72.2 | 76.5 | +4.3 | +3.9 |
| Gallbladder/bile ducts, F | 20.1 | 19.9 | −0.2 | −0.2 | 2,962 / 2,548 | 20.3 | 22.1 | +1.8 | +1.7 |
| Pancreas, M | 7.0 | 7.1 | +0.1 | +0.1 | 2,855 / 3,205 | 5.0 | 8.9 | +3.9 | +6.6 |
| Corpus uteri, F | 79.5 | 79.8 | +0.3 | +0.2 | 1,688 / 2,428 | 79.2 | 81.3 | +2.1 | +1.7 |
| Multiple myeloma, F | 30.9 | 31.2 | +0.3 | +0.1 | 446 / 553 | 32.4 | 43.6 | +11.2 | +4.1 |
| Thyroid, F | 93.2 | 93.7 | +0.5 | +0.5 | 2,483 / 2,267 | 93.3 | 95.8 | +2.5 | +2.9 |
| Thyroid, M | 86.3 | 87.0 | +0.7 | +0.3 | 541 / 663 | 86.9 | 91.3 | +4.4 | +2.0 |
| Colon, M | 71.3 | 72.2 | +0.9 | +1.1 | 10,542 / 10,721 | 72.1 | 72.8 | +0.7 | +1.0 |
| Pancreas, F | 5.9 | 6.9 | +1.0 | +1.4 | 2,205 / 2,684 | 6.0 | 8.1 | +2.1 | +3.2 |
| Stomach, F | 60.4 | 61.5 | +1.1 | +1.6 | 14,817 / 11,825 | 62.4 | 64.6 | +2.2 | +3.8 |
| Colon, F | 66.1 | 67.9 | +1.8 | +2.1 | 8,609 / 9,763 | 67.0 | 69.4 | +2.4 | +3.5 |
| Stomach, M | 62.1 | 64.2 | +2.1 | +4.2 | 29,318 / 24,586 | 65.1 | 67.5 | +2.4 | +5.2 |
| Rectum, M | 65.0 | 67.3 | +2.3 | +2.3 | 7,089 / 6,983 | 66.1 | 71.7 | +5.6 | +6.3 |
| Oral cavity/pharynx, M | 48.6 | 51.7 | +3.1 | +1.9 | 2,535 / 2,351 | 52.0 | 60.7 | +8.7 | +6.1 |
| Gallbladder/bile ducts, M | 19.0 | 22.5 | +3.5 | +2.6 | 2,475 / 2,268 | 23.5 | 26.8 | +3.3 | +2.6 |
| Leukemia, M | 31.7 | 35.4 | +3.7 | +2.1 | 1,686 / 1,555 | 29.6 | 43.4 | +13.8 | +9.1 |
| Rectum, F | 63.9 | 67.8 | +3.9 | +3.2 | 4,316 / 4,091 | 66.1 | 71.9 | +5.8 | +5.6 |
| Lung, M | 20.8 | 25.0 | +4.2 | +7.4 | 15,124 / 16,561 | 24.7 | 29.5 | +4.8 | +10.4 |
| Liver, F | 21.8 | 26.2 | +4.4 | +4.1 | 3,619 / 3,619 | 25.7 | 35.1 | +9.4 | +9.0 |
| Breast, F | 84.4 | 89.1 | +4.7 | +9.4 | 14,094 / 17,162 | 87.7 | 92.3 | +4.6 | +13.8 |
| Multiple myeloma, M | 29.3 | 34.0 | +4.7 | +1.5 | 508 / 603 | 25.3 | 41.9 | +16.6 | +6.2 |
| Ovary, F | 49.4 | 55.0 | +5.6 | +3.6 | 2,116 / 2,447 | 53.3 | 60.0 | +6.7 | +5.0 |
| Leukemia, F | 33.2 | 39.8 | +6.6 | +3.2 | 1,234 / 1,170 | 35.7 | 44.9 | +9.2 | +5.0 |
| Esophagus, M | 25.7 | 32.3 | +6.6 | +6.2 | 4,401 / 4,694 | 32.8 | 40.6 | +7.8 | +8.3 |
| Liver, M | 21.0 | 28.7 | +7.7 | +10.7 | 9,958 / 7,416 | 27.7 | 36.2 | +8.5 | +11.9 |
| Esophagus, F | 33.1 | 41.3 | +8.2 | +3.3 | 843 / 861 | 35.5 | 45.9 | +10.4 | +4.7 |
| Malignant lymphoma, M | 46.3 | 54.9 | +8.6 | +5.5 | 2,349 / 2,525 | 51.2 | 66.4 | +15.2 | +11.5 |
| Malignant lymphoma, F | 51.4 | 63.1 | +11.7 | +6.6 | 1,800 / 2,178 | 58.6 | 68.6 | +10.0 | +7.1 |
| Lung, F | 27.1 | 41.0 | +13.9 | +15.1 | 5,618 / 6,616 | 39.0 | 46.8 | +7.8 | +9.8 |
| Prostate, M | 66.8 | 93.8 | +27.0 | +24.1 | 4,220 / 12,204 | 84.6 | 99.1 | +14.5 | +17.5 |
Observation 5.2: Over the 9.5 years from 1993–96 to 2003–05, the figures of the 35 groups moved from −6.2 points for bladder, female, to +27.0 points for prostate, male. The median is +2.3 points. Eighteen groups rose by more than two standard errors, 2 fell by more than two (bladder, male and female), and 15 stayed within two. Prostate went from 66.8 to 93.8, lung, female, from 27.1 to 41.0, and malignant lymphoma, female, from 51.4 to 63.1. Pancreas, male, went from 7.0 to 7.1, hardly moving.
Observation 5.3: An old figure is not necessarily a lower one. Bladder fell, male 80.0 to 76.5 (−2.5 standard errors) and female 70.6 to 64.4 (−2.4). From 2000–02 to 2009–11 as well, the only groups falling by more than two standard errors were bladder, male and female (−3.4 and −5.2 points), while 29 rose. In the later pair the covered areas widened from 6 to 22 prefectures, and the paper cannot separate the change of areas from the movement of the figures. It does not go into why they fell.
Observation 5.4: Larynx, female, has 90 people in 1993–96 and 82 in 2003–05, so its standard errors are large (a difference of −1.3 points is −0.2 standard errors). Where the multiple is small, a group cannot be said to have moved even if the figure looks as if it moved a lot.
Observation 5.5: The all-sites figures moved too (both sexes 53.2 to 58.6, male 48.9 to 55.4, female 59.0 to 62.9). But all sites also carry changes in the mix of sites. Prostate rose from 0.040 to 0.112 of the male all-sites people (4,220 to 12,204). The paper does not separate the effect of the mix from the movement by site.
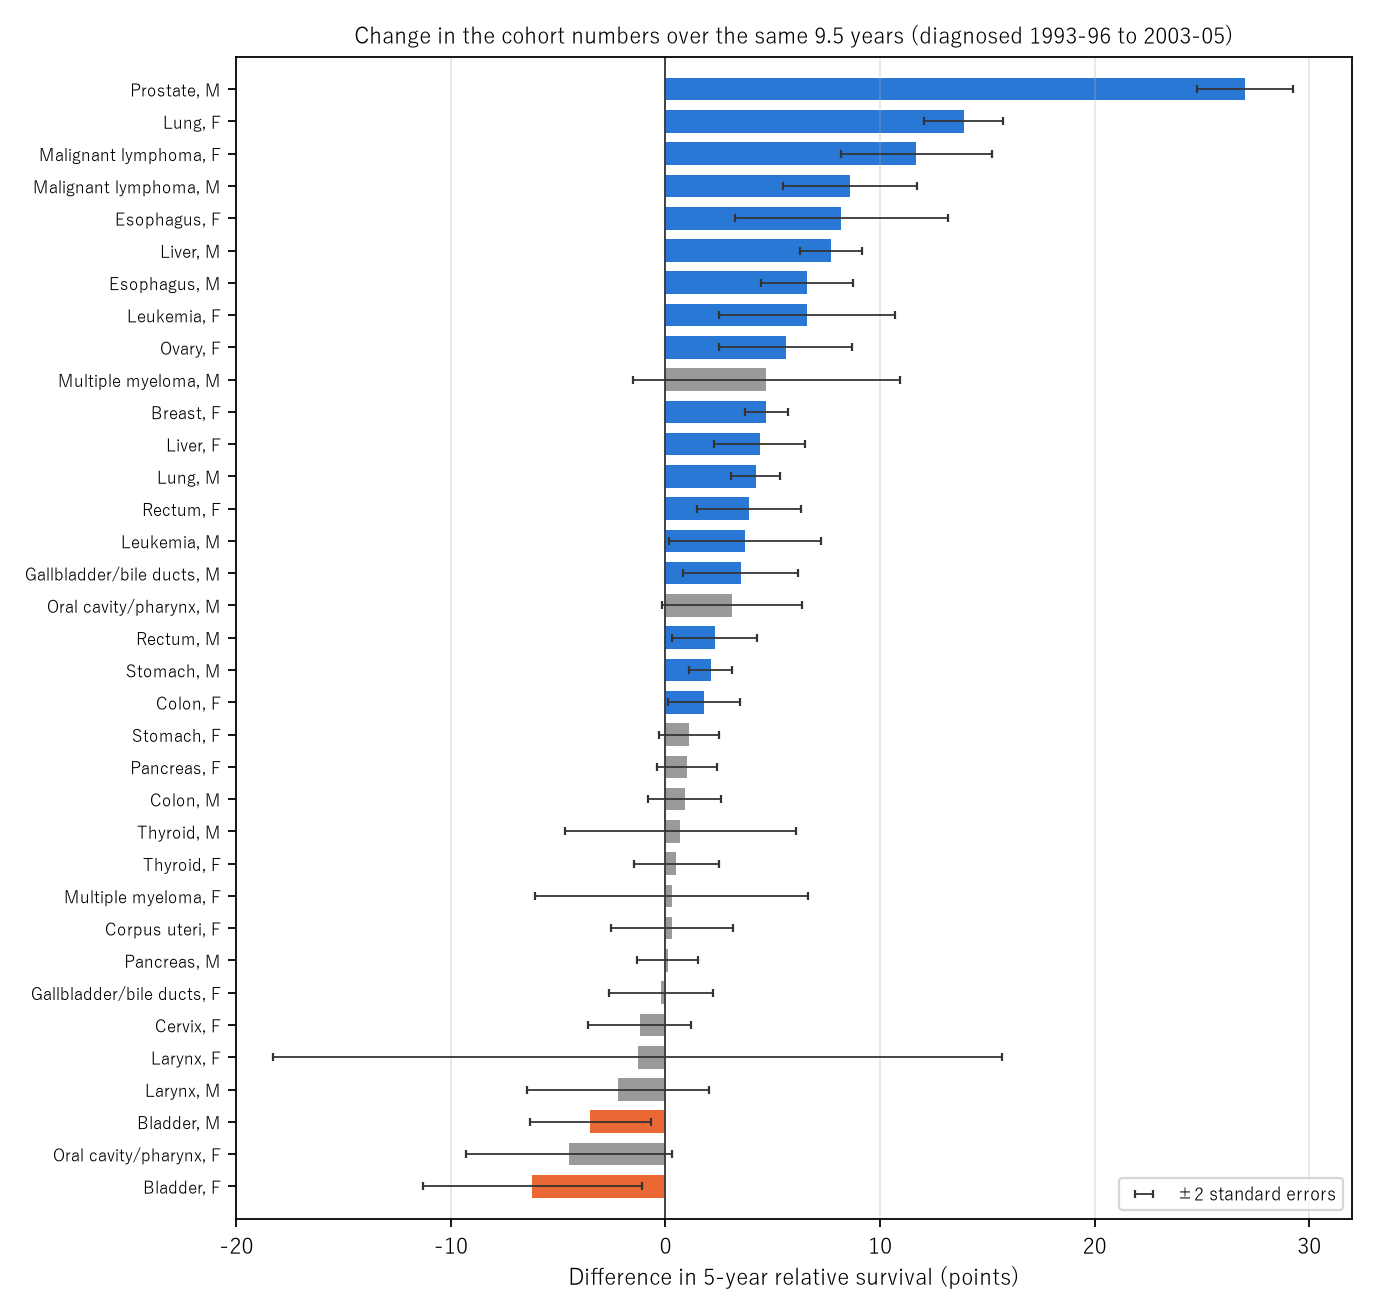
Figure 2: Difference in 5-year relative survival (points) from diagnoses in 1993–96 to diagnoses in 2003–05. Blue groups rose by more than two standard errors, orange groups fell by more than two, and grey groups stayed within two. The black bars are ±2 standard errors.
6. Setting the period figures beside the cohort figures for the same areas
Calculation 6.1 Period figures (follow-up 2002–2006, ages 15–99), cohort figures for the same 6 prefectures (diagnosed 1993–2002), and diagnoses in 2003–05 for 7 prefectures (%). The right column is period − 2000–02 (points).
| Site, sex | Period | 1993–96 | 1997–99 | 2000–02 | 2003–05 | Period − 2000–02 |
|---|---|---|---|---|---|---|
| Oral cavity/pharynx, M | 49.7 | 48.6 | 48.3 | 52.0 | 51.7 | −2.3 |
| Oral cavity/pharynx, F | 60.0 | 64.7 | 63.0 | 60.6 | 60.2 | −0.6 |
| Esophagus, M | 32.2 | 25.7 | 30.7 | 32.8 | 32.3 | −0.6 |
| Esophagus, F | 37.6 | 33.1 | 37.3 | 35.5 | 41.3 | +2.1 |
| Stomach, M | 63.3 | 62.1 | 62.6 | 65.1 | 64.2 | −1.8 |
| Stomach, F | 60.3 | 60.4 | 61.2 | 62.4 | 61.5 | −2.1 |
| Colon, M | 70.9 | 71.3 | 71.0 | 72.1 | 72.2 | −1.2 |
| Colon, F | 65.3 | 66.1 | 66.4 | 67.0 | 67.9 | −1.7 |
| Rectum, M | 65.5 | 65.0 | 65.7 | 66.1 | 67.3 | −0.6 |
| Rectum, F | 66.9 | 63.9 | 64.5 | 66.1 | 67.8 | +0.8 |
| Liver, M | 25.3 | 21.0 | 23.7 | 27.7 | 28.7 | −2.4 |
| Liver, F | 23.6 | 21.8 | 21.8 | 25.7 | 26.2 | −2.1 |
| Gallbladder/bile ducts, M | 21.5 | 19.0 | 21.8 | 23.5 | 22.5 | −2.0 |
| Gallbladder/bile ducts, F | 17.8 | 20.1 | 18.9 | 20.3 | 19.9 | −2.5 |
| Pancreas, M | 5.9 | 7.0 | 6.2 | 5.0 | 7.1 | +0.9 |
| Pancreas, F | 5.9 | 5.9 | 7.3 | 6.0 | 6.9 | −0.1 |
| Larynx, both | 79.2 | 78.1 | 76.1 | 77.8 | 75.9 | +1.4 |
| Lung, M | 22.8 | 20.8 | 22.4 | 24.7 | 25.0 | −1.9 |
| Lung, F | 37.0 | 27.1 | 33.5 | 39.0 | 41.0 | −2.0 |
| Breast, F | 87.6 | 84.4 | 85.5 | 87.7 | 89.1 | −0.1 |
| Cervix, F | 69.3 | 73.4 | 71.5 | 72.2 | 72.2 | −2.9 |
| Corpus uteri, F | 78.6 | 79.5 | 76.8 | 79.2 | 79.8 | −0.6 |
| Ovary, F | 51.3 | 49.4 | 52.0 | 53.3 | 55.0 | −2.0 |
| Prostate, M | 87.4 | 66.8 | 75.5 | 84.6 | 93.8 | +2.8 |
| Bladder, M | 79.1 | 80.0 | 78.6 | 79.9 | 76.5 | −0.8 |
| Bladder, F | 65.9 | 70.6 | 69.8 | 68.2 | 64.4 | −2.3 |
| Thyroid, M | 89.0 | 86.3 | 87.6 | 86.9 | 87.0 | +2.1 |
| Thyroid, F | 95.5 | 93.2 | 93.5 | 93.3 | 93.7 | +2.2 |
| Malignant lymphoma, M | 49.6 | 46.3 | 46.6 | 51.2 | 54.9 | −1.6 |
| Malignant lymphoma, F | 58.1 | 51.4 | 54.2 | 58.6 | 63.1 | −0.5 |
| Multiple myeloma, M | 27.7 | 29.3 | 31.5 | 25.3 | 34.0 | +2.4 |
| Multiple myeloma, F | 29.6 | 30.9 | 28.1 | 32.4 | 31.2 | −2.8 |
Observation 6.2: The period figure was above the 2000–02 cohort in 8 of 32 groups. The median difference is −1.0 points, the smallest −2.9 and the largest +2.8. The rank correlation between the speed of change from 1993–96 to 2000–02 (points per year) and this difference is −0.140, so there is no sign that faster-moving sites put the period figure higher. The period figure is above all three cohorts for the same 6 prefectures (diagnosed 1993–2002) in 6 groups, and below all three in 7.
Observation 6.3: This difference is not read as "because it is the period method." As in Calculation 3.2, the two tables differ in age range (whether 15–99) and exclusion rules (only the cohort side excludes trace-back patients; the wording on in situ cancers differs). Whether the period figure sits on the newer side cannot be measured with these two tables.
Observation 6.4: Only for prostate, which moved the most, is the order clear. The period figure 87.4 is above each of 1993–96 (66.8), 1997–99 (75.5), and 2000–02 (84.6) for the same 6 prefectures, and below 2003–05 (93.8). The step-by-step differences of the prostate cohort figures (+8.7, +9.1, +9.2 points) are larger than the range of "period − 2000–02" over the 32 groups (−2.9 to +2.8 points).
7. Limitations
- The paper does not go into why the figures moved. It does not separate changes in diagnosis, treatment, registration, or covered areas.
- It does not say how the figures will move from here. What it measured is the movement over past spans of the same length.
- The covered areas differ by year. 1993–96 to 2003–05 is 6 and 7 prefectures; 2000–02 to 2009–11 is 6 and 22 prefectures.
- The effect of the period method could not be measured. The two tables differ in age range and exclusion rules.
- It does not recompute survival. It uses the values in the tables.
- It is not a forecast for one person. It does not compare prefectures, areas, or facilities.
Conclusion
The newest cohort figures in the tables describe people diagnosed in 2009–2011, reported in 2020: 9.5 years after the diagnosis midpoint. Over the same 9.5 years, the figures by site had moved from −6.2 points for bladder, female, to +27.0 points for prostate, male. The period method puts diagnoses five years newer into the figure at the same moment. With the two tables used here, however, whether the period figure sits on the newer side could not be measured.
One thing separates them — whether people are grouped by the year of diagnosis (cohort) or by the year of follow-up (period).
When reading a 5-year survival figure, recall together in which years the people behind it were diagnosed, and in which direction and how far the figures for that site have moved since.
Data and reproduction
| Data | Tables of 5-year relative survival by site based on population-based cancer registries (diagnosed 1993–2011) and of 10-year relative survival and conditional 5-year relative survival (followed 2002–2006) (Cancer Information Service, accessed 26 September 2026) |
| Terms of use | Used with the source stated as "National Cancer Center Japan, Cancer Information Service." The values in the tables are shown unaltered, kept apart from this paper's calculations (differences, midpoint years, multiples of standard errors, rank correlation) |
| Scope | Diagnosed 1993–2011 (cohort figures), followed 2002–2006 (period figures) |
| Verification | 検算/M023.py (--zu also writes the figures). Every number in the text is taken from 検算/M023_output.txt |
| Raw data | The 2 retrieved files and SOURCES.md (URLs, retrieval dates, SHA-256, terms of use, copies of the tables' notes, definitions and calculation) in data/ |
| Figures | 図/M023_zu1, 図/M023_zu2 (png, svg, English versions) |
References
- Center for Cancer Control and Information Services, National Cancer Center (2020). Monitoring of Cancer Incidence in Japan - Survival 2009-2011 Report.
- Ito, Y., Miyashiro, I., Ito, H., Hosono, S., Chihara, D., Nakata-Yamada, K., et al. (2014). Long-term Survival and Conditional Survival of Cancer Patients in Japan Using Population-based Cancer Registry Data. Cancer Science. 10.1111/cas.12525
- Matsuda, T., Ajiki, W., Marugame, T., Ioka, A., Tsukuma, H., & Sobue, T. (2011). Population-based Survival of Cancer Patients Diagnosed Between 1993 and 1999 in Japan: A Chronological and International Comparative Study. Japanese Journal of Clinical Oncology. 10.1093/jjco/hyq167
- National Cancer Center Japan, Cancer Information Service. 5-year relative survival by site based on population-based cancer registries (diagnosed 1993-2011), cancer_survival(1993-2011).xls (in Japanese; accessed 26 September 2026). https://ganjoho.jp/reg_stat/statistics/data/dl/excel/cancer_survival%281993-2011%29.xls
- National Cancer Center Japan, Cancer Information Service. 10-year relative survival and conditional 5-year relative survival based on population-based cancer registries (followed 2002-2006, period analysis), cancer_survival_period(2002-2006).xls (in Japanese; accessed 26 September 2026). https://ganjoho.jp/reg_stat/statistics/data/dl/excel/cancer_survival_period%282002-2006%29.xls
- Yamagishi, Y. (2026). Life Expectancy Is Not the Number of Years Anyone Actually Lives [M003]. Zenodo. https://doi.org/10.5281/zenodo.22963485
- Yamagishi, Y. (2026). The "5-Year Survival" You Once Heard Is Rewritten by the Years You Have Lived [M006]. Zenodo. https://doi.org/10.5281/zenodo.22964113
Reference
Yamagishi, Y. (2026). A Reported 5-Year Survival Figure Describes People Diagnosed About Ten Years Before the Report [M023]. Zenodo.
DOI: 10.5281/zenodo.22968328
YOI: https://www.yamagishiyuuki.com/yoi/M023
ORCID: 0009-0006-8587-3450
PDF (English) · PDF (Japanese) · Date proof of the English PDF (OpenTimestamps .ots) · SHA256SUMS
The record page for this paper (in Japanese, with the PDFs in each language and the date proof): YOI M023. This paper is a preprint and has not been peer reviewed.