Abstract
This paper asks whether the 5-year survival that rose with year of diagnosis rose because "more people were found at early stages" (a shift in the stage mix) or because "survival rose within the same stage" (a rise in stage-specific survival). Using population-based cancer registry 5-year relative survival for diagnoses in 1993–2011 (by clinical stage, both sexes), it applies the split of M026 along time. It claims no new mathematical theorem and no new law.
First, survival of people with known stage (the average of the three stages' survival weighted by numbers of people; this paper's calculation) rose for stomach from 63.8 (1993–96) to 66.0 (2003–05) and 69.0 (2009–11) (Section 4).
Second, this is the core of the paper. The stomach rise of +2.2 points from 1993–96 to 2003–05 splits into a stage-mix effect of −0.3 points and a stage-specific effect of +2.5 points. Among people with known stage, the localized share rose a little, from 54.1% to 55.2%, but the distant share also rose, from 15.3% to 17.7%, so the stage mix carries almost none of the rise. Through 2009–11, too, +5.1 points = stage mix +0.1 + stage-specific +5.0. The rise of regional survival from 40.2 to 51.9 matters most (Section 5).
Third, only prostate is the other way: of its +22.7-point rise from 1993–96 to 2003–05, +13.8 points (0.61) is the stage-mix effect. The localized share rose from 43.0% to 66.1% and the distant share fell from 40.3% to 16.2%. Through 2009–11, 0.56 is still the stage mix (Section 5).
Fourth, of the 16 sites compared, the stage-mix effect is the larger one from 1993–96 to 2003–05 for 3 (prostate, cervix, thyroid); for the others the stage-specific effect is larger. Bladder fell, with both effects negative (Section 5).
Fifth, this split needs two cautions. One is people with unknown stage: their share moves between periods (stomach 17.3% → 8.3% → 7.2%), and in the two periods of 1993–1999 the denominator of the shares is 1.014–1.218 times the number of people in the survival analysis. The other is the reassignment of stage: if diagnostic methods change, stage-specific survival can rise at every stage merely because people move to another stage (the Will Rogers phenomenon). This paper's "stage-specific effect" may include that (Sections 3 and 6).
Sixth, what separates them is the mix of stages at diagnosis and the survival within each stage.
Scope note: This paper claims no new mathematical theorem and no new law — splitting a difference in rates into composition and within-stratum rates, and the possibility that reassigning stage moves stratum-specific rates in appearance (Feinstein et al. 1985), are known. The paper only lays out the figures of a published table and splits the rises in two. This paper is a structural interpretation of the shape of numbers in published aggregate data, and is not medical advice, diagnosis, or a treatment recommendation. The author is not a physician. For decisions about individual health, consult a physician or medical institution. It is a preprint that has not been peer reviewed. It does not discuss the effectiveness of screening — it does not go into the reasons for shifts in the stage mix (screening, diagnostic methods, symptoms). It does not read the "stage-specific effect" as progress in treatment — the reassignment of stage and changes in the spread within a stage cannot be separated. It is not a forecast for one person. It does not compare prefectures or areas — the covered areas differ by period (6, 7, 21, and 22 prefectures). About the data: used with the source stated as "National Cancer Center Japan, Cancer Information Service"; the values in the table are shown unaltered and kept apart from this paper's calculations (weighted averages, splitting of rises). All sites and periods with known stage are included in the tables. What the paper adds: splitting the rises in survival for 16 sites into stage mix and stage-specific survival, showing that for stomach the stage mix carries almost none of the rise while for prostate it carries more than half, and finding that the denominator of the shares differs only in the 1993–1999 periods, and confirming that this paper's shares, built from numbers of people, are not affected by it.
1. Notation and question
- Stage: clinical stage, localized, regional, distant (as in the table's notes).
- Survival of people with known stage (this paper's calculation): the average of the three stages' 5-year relative survival weighted by the three numbers of people, as in M026.
- Splitting a rise: the difference between two periods = stage-mix effect Σ (difference in share × average survival) + stage-specific effect Σ (average share × difference in survival) (Kitagawa's decomposition). Shares are shares among people with known stage.
- Periods compared: mainly 1993–1996 to 2003–2005 (9.5 years between diagnosis midpoints; 6 and 7 prefectures, almost the same areas), alongside 1993–1996 to 2009–2011 (15.5 years; 6 and 22 prefectures), as in M023.
Question: how does the rise in 5-year survival split into a shift in the stage mix at diagnosis and a rise in stage-specific survival?
Observation 1.1: M026 split differences between sites among people diagnosed in the same year. This paper applies the same split to differences between years of diagnosis for the same site.
2. Survey and design
Stated honestly: the design was set after seeing the table.
| Content | |
|---|---|
| Survival by stage | Sheet "推移データ(進行度別)" of the table: numbers of people, 5-year relative survival, and standard errors for localized, regional, and distant in 6 periods (both sexes) |
| Stage shares | Sheet "推移データ(進行度の割合)" of the same table: numbers and shares by stage and share of unknown stage in the same periods |
| Overall survival | Both sexes in sheet "推移データ(性別)" of the same table (for comparison) |
| Expectation and what was measured | Before the survey the expectation was "the stomach rise comes from more people being found at early stages." Split, the stage-mix effect was −0.3 points |
3. Data and checks
Calculation 3.1 The retrieved file was fixed by SHA-256, and the following was checked.
- The numbers of people in the two sheets (stage-specific survival, stage shares) agree for every site × period.
- Three shares + unknown = 100 (within 0.2, the width of four roundings; largest deviation 0.10).
- Back-calculating the denominator of the shares from each of the three stages as "number ÷ share × 100," the three agree for each site × period (largest spread 0.013).
- There are 0 cells with fewer than 10 people.
- The table cites, as sources for the trend data, the Survival 2009-2011 Report (Center for Cancer Control and Information Services, 2020) and Matsuda et al. (2011).
Observation 3.2: Only in the two periods of 1993–1999 is the denominator of the shares larger than the number of people in the survival analysis. Denominator ÷ number in the survival analysis is 0.996–1.008 in the four periods of 2000–2011 and 1.014–1.218 in the two periods of 1993–1999 (all sites 1.096 and 1.092; liver 1993–1996 1.218). The reason is not written in the table. The unknown-stage shares of 1993–1999 do not share the denominator of later periods. This paper's "shares among people with known stage" are built from the three numbers of people and are not affected by this difference in denominator.
Observation 3.3: The share of unknown stage for all sites moves: 24.6% (1993–96), 22.6%, 13.8%, 14.6%, 20.1%, 12.3% (2009–11). It grows in 2006–08, the period when the covered areas widened from 7 to 21 prefectures.
4. Survival of people with known stage over time
Calculation 4.1 Survival of people with known stage (this paper's calculation), with overall 5-year relative survival (table, both sexes) in parentheses (%).
| Site | 1993–96 | 1997–99 | 2000–02 | 2003–05 | 2006–08 | 2009–11 |
|---|---|---|---|---|---|---|
| All sites | 56.3 (53.2) | 57.6 (54.3) | 59.2 (56.9) | 61.7 (58.6) | 64.4 (62.1) | 66.4 (64.1) |
| Oral cavity/pharynx | 53.5 (53.2) | 54.6 (52.9) | 54.4 (54.6) | 56.7 (54.3) | 61.2 (60.2) | 64.6 (63.5) |
| Esophagus | 27.8 (26.9) | 33.2 (31.6) | 34.1 (33.2) | 35.5 (33.7) | 37.5 (37.2) | 42.9 (41.5) |
| Stomach | 63.8 (61.6) | 64.8 (62.1) | 66.2 (64.3) | 66.0 (63.3) | 67.1 (64.6) | 69.0 (66.6) |
| Colon | 70.7 (68.9) | 70.9 (68.9) | 70.7 (69.7) | 72.1 (70.1) | 73.2 (71.6) | 73.1 (71.2) |
| Rectum | 66.8 (64.6) | 67.5 (65.2) | 67.1 (66.1) | 69.8 (67.5) | 71.8 (70.1) | 73.5 (71.8) |
| Liver | 23.1 (21.2) | 25.8 (23.1) | 29.2 (27.1) | 31.3 (27.9) | 34.8 (32.6) | 37.8 (35.8) |
| Gallbladder/bile ducts | 22.1 (19.6) | 22.3 (20.2) | 24.0 (21.8) | 24.1 (21.1) | 24.7 (22.5) | 26.7 (24.5) |
| Pancreas | 6.4 (6.5) | 6.8 (6.7) | 5.4 (5.5) | 7.4 (7.0) | 7.6 (7.7) | 8.7 (8.5) |
| Lung | 23.6 (22.5) | 27.6 (25.6) | 30.6 (29.0) | 32.1 (29.7) | 33.9 (31.9) | 36.7 (34.9) |
| Breast | 85.6 (84.4) | 86.7 (85.5) | 88.1 (87.7) | 90.0 (89.1) | 92.0 (91.1) | 93.1 (92.3) |
| Uterus | 75.7 (74.4) | 74.1 (72.5) | 75.1 (74.2) | 76.7 (75.0) | 78.4 (76.9) | 79.7 (78.7) |
| Cervix | 74.1 (73.4) | 72.7 (71.5) | 72.6 (72.2) | 73.0 (72.2) | 74.7 (73.4) | 76.8 (76.5) |
| Corpus uteri | 81.5 (79.5) | 77.9 (76.8) | 80.2 (79.2) | 81.6 (79.8) | 82.3 (81.1) | 82.5 (81.3) |
| Ovary | 50.5 (49.4) | 53.7 (52.0) | 53.3 (53.3) | 57.1 (55.0) | 59.9 (58.0) | 61.6 (60.0) |
| Prostate | 67.5 (66.8) | 75.7 (75.5) | 82.4 (84.6) | 90.2 (93.8) | 92.8 (97.5) | 94.2 (99.1) |
| Bladder | 81.3 (77.8) | 78.6 (76.5) | 79.2 (77.2) | 76.4 (73.5) | 76.8 (76.1) | 75.4 (73.3) |
| Thyroid | 92.7 (92.0) | 93.2 (92.4) | 92.0 (92.1) | 93.2 (92.2) | 94.3 (93.7) | 95.0 (94.7) |
Observation 4.2: Stomach survival of people with known stage went 63.8 → 66.0 → 69.0 (1993–96, 2003–05, 2009–11), and overall 61.6 → 63.3 → 66.6. Prostate rose sharply, 67.5 → 90.2 → 94.2.
5. Core — splitting the rises in two
Calculation 5.1 The rise in survival of people with known stage, split into stage-mix and stage-specific effects (points).
| Site | 1993–96 | 2003–05 | Rise | Stage mix | Stage-specific | 2009–11 | Rise | Stage mix | Stage-specific |
|---|---|---|---|---|---|---|---|---|---|
| All sites | 56.3 | 61.7 | +5.4 | +1.0 | +4.3 | 66.4 | +10.1 | +0.6 | +9.5 |
| Oral cavity/pharynx | 53.5 | 56.7 | +3.2 | −0.9 | +4.1 | 64.6 | +11.1 | −1.1 | +12.2 |
| Esophagus | 27.8 | 35.5 | +7.7 | −0.3 | +8.0 | 42.9 | +15.1 | −1.2 | +16.3 |
| Stomach | 63.8 | 66.0 | +2.2 | −0.3 | +2.5 | 69.0 | +5.1 | +0.1 | +5.0 |
| Colon | 70.7 | 72.1 | +1.4 | −0.5 | +1.9 | 73.1 | +2.4 | −3.5 | +5.9 |
| Rectum | 66.8 | 69.8 | +3.0 | −1.1 | +4.1 | 73.5 | +6.7 | −3.1 | +9.8 |
| Liver | 23.1 | 31.3 | +8.2 | +0.4 | +7.8 | 37.8 | +14.7 | −0.9 | +15.6 |
| Gallbladder/bile ducts | 22.1 | 24.1 | +1.9 | −0.4 | +2.4 | 26.7 | +4.6 | −3.6 | +8.2 |
| Pancreas | 6.4 | 7.4 | +1.0 | −0.5 | +1.5 | 8.7 | +2.4 | −1.7 | +4.1 |
| Lung | 23.6 | 32.1 | +8.4 | +2.3 | +6.1 | 36.7 | +13.1 | +1.6 | +11.5 |
| Breast | 85.6 | 90.0 | +4.4 | +1.0 | +3.3 | 93.1 | +7.5 | +1.0 | +6.5 |
| Uterus | 75.7 | 76.7 | +1.0 | −0.6 | +1.6 | 79.7 | +3.9 | −3.0 | +6.9 |
| Cervix | 74.1 | 73.0 | −1.1 | −1.5 | +0.4 | 76.8 | +2.7 | −4.8 | +7.5 |
| Corpus uteri | 81.5 | 81.6 | +0.0 | −1.3 | +1.3 | 82.5 | +1.0 | −3.0 | +3.9 |
| Ovary | 50.5 | 57.1 | +6.6 | +1.8 | +4.8 | 61.6 | +11.1 | −0.3 | +11.4 |
| Prostate | 67.5 | 90.2 | +22.7 | +13.8 | +8.8 | 94.2 | +26.6 | +15.0 | +11.7 |
| Bladder | 81.3 | 76.4 | −4.9 | −1.6 | −3.3 | 75.4 | −6.0 | −3.1 | −2.9 |
| Thyroid | 92.7 | 93.2 | +0.4 | +0.3 | +0.2 | 95.0 | +2.3 | +0.4 | +1.8 |
Calculation 5.2 Stomach: 5-year relative survival by stage and shares among people with known stage (%)
| Period | Localized survival | Regional survival | Distant survival | Localized share | Regional share | Distant share |
|---|---|---|---|---|---|---|
| 1993–96 | 94.4 | 40.2 | 3.1 | 54.1 | 30.5 | 15.3 |
| 1997–99 | 95.2 | 39.8 | 2.9 | 55.3 | 29.4 | 15.3 |
| 2000–02 | 95.9 | 43.2 | 3.9 | 56.1 | 27.3 | 16.6 |
| 2003–05 | 96.0 | 44.8 | 5.1 | 55.2 | 27.1 | 17.7 |
| 2006–08 | 95.9 | 50.0 | 5.7 | 55.7 | 25.2 | 19.0 |
| 2009–11 | 96.7 | 51.9 | 6.6 | 58.0 | 22.3 | 19.7 |
Observation 5.3: For stomach, the stage-specific effect is larger than the stage-mix effect in both spans (+2.5 against −0.3; +5.0 against +0.1). The localized share rose a little, but so did the distant share, and the two cancel. Most of the rise comes from regional survival rising from 40.2 to 51.9 and distant from 3.1 to 6.6.
Observation 5.4: Prostate is the other way. Of its +22.7-point rise from 1993–96 to 2003–05, +13.8 points (0.61) is the stage-mix effect; through 2009–11, 0.56 still is. The localized share rose from 43.0% to 66.1% (69.5% in 2009–11) and the distant share fell from 40.3% to 16.2% (12.2%).
Observation 5.5: From 1993–96 to 2003–05, the stage-mix effect is the larger one for 3 of 16 sites (prostate, cervix, thyroid). For corpus uteri the two effects are stage mix −1.27 and stage-specific +1.30, almost the same size (on the boundary), so calculating with rounded shares gives 4 sites. From 1993–96 to 2009–11 it is 2 sites (prostate, bladder). Bladder fell by −4.9 points from 1993–96 to 2003–05, with both effects negative.
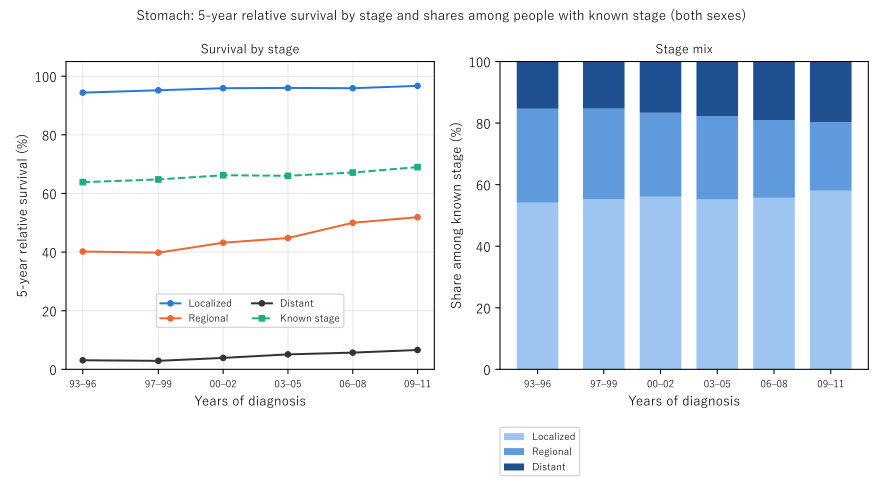
Figure 1: Left: stomach 5-year relative survival by stage, and survival of people with known stage (this paper's calculation). Right: shares of localized, regional, and distant among people with known stage.
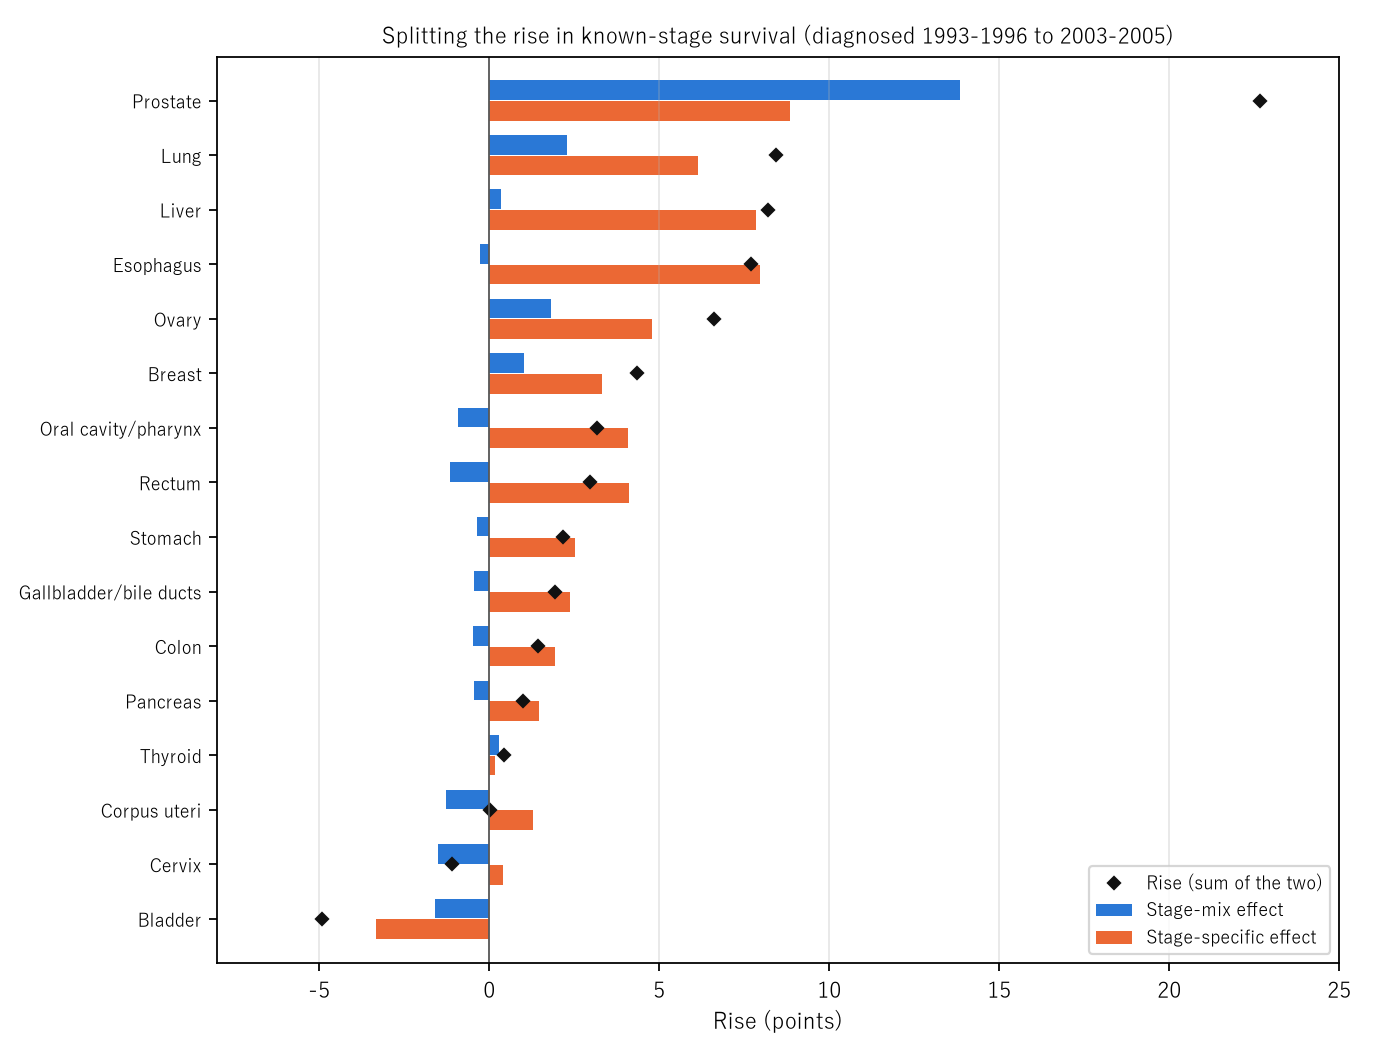
Figure 2: The rise (◆) in survival of people with known stage from diagnoses in 1993–96 to 2003–05, split into the stage-mix effect (blue) and the stage-specific effect (orange).
6. What the stage-specific effect does not show
Observation 6.1: Reassignment of stage: if diagnostic methods change so that some people formerly called localized are now called regional, and some regional now distant, those who move enter the better-off end of their new stage, and survival can rise at every stage — even if nothing changes overall. Feinstein et al. (1985) showed this and called it the Will Rogers phenomenon. The tables here alone cannot separate this reassignment from real rises in survival within the same stage.
Observation 6.2: People with unknown stage: this paper compares only people with known stage. Since the unknown share moves between periods (Observation 3.3), the movement of "people formerly unknown now being given a stage" can enter both the stage mix and the stage-specific values.
7. Limitations
- Reassignment of stage is not separated (Observation 6.1).
- People with unknown stage are not included. The unknown shares of 1993–1999 have a different denominator from later periods.
- The covered areas differ by period. 1993–96 to 2003–05 is 6 and 7 prefectures; to 2009–11, 22 prefectures.
- Only both sexes combined were examined. Stage-specific values are published only for both sexes combined.
- The effectiveness of screening and progress in treatment are not discussed.
- It is not a forecast for one person. It does not compare prefectures or areas.
Conclusion
Stomach cancer 5-year survival among people with known stage rose from 63.8 to 66.0 between 1993–96 and 2003–05. The rise split into a stage-mix effect of −0.3 points and a stage-specific effect of +2.5 points; more people being found at early stages carried almost none of it. Prostate was the other way, with 0.61 of its rise from the stage mix. The stage-specific effect, however, may include the reassignment of stage.
Two things separate them — the mix of stages at diagnosis and the survival within each stage.
When hearing that survival has risen, recall together whether it is a shift in the stages at which people are found or a change within the same stage, and whether the way stages are assigned has changed.
Data and reproduction
| Data | Table of 5-year relative survival by site based on population-based cancer registries (diagnosed 1993–2011, by stage, both sexes) (Cancer Information Service, accessed 26 September 2026) |
| Terms of use | Used with the source stated as "National Cancer Center Japan, Cancer Information Service." The values in the table are shown unaltered and kept apart from this paper's calculations (weighted averages, splitting of rises) |
| Scope | Diagnosed 1993–2011 (6 periods) |
| Verification | 検算/M027.py (--zu also writes the figures). Every number in the text is taken from 検算/M027_output.txt |
| Raw data | The retrieved file and SOURCES.md (URL, retrieval date, SHA-256, terms of use, copies of the file's notes, definitions and calculation) in data/ |
| Figures | 図/M027_zu1, 図/M027_zu2 (png, svg, English versions) |
References
- Center for Cancer Control and Information Services, National Cancer Center (2020). Monitoring of Cancer Incidence in Japan - Survival 2009-2011 Report.
- Feinstein, A. R., Sosin, D. M., & Wells, C. K. (1985). The Will Rogers Phenomenon. New England Journal of Medicine. 10.1056/NEJM198506203122504
- Matsuda, T., Ajiki, W., Marugame, T., Ioka, A., Tsukuma, H., & Sobue, T. (2011). Population-based Survival of Cancer Patients Diagnosed Between 1993 and 1999 in Japan: A Chronological and International Comparative Study. Japanese Journal of Clinical Oncology. 10.1093/jjco/hyq167
- National Cancer Center Japan, Cancer Information Service. 5-year relative survival by site based on population-based cancer registries (diagnosed 1993-2011), cancer_survival(1993-2011).xls (in Japanese; accessed 26 September 2026). https://ganjoho.jp/reg_stat/statistics/data/dl/excel/cancer_survival%281993-2011%29.xls
- Yamagishi, Y. (2026). A Reported 5-Year Survival Figure Describes People Diagnosed About Ten Years Before the Report [M023]. Zenodo. https://doi.org/10.5281/zenodo.22968328
- Yamagishi, Y. (2026). Differences in 5-Year Survival Between Sites Split into Stage Mix and Stage-Specific Survival — Bladder and Lung Are Nearly Equal Stage by Stage, Yet Combined They Are 69.6 Versus 41.9 [M026]. Zenodo. https://doi.org/10.5281/zenodo.22968675
Reference
Yamagishi, Y. (2026). The Rise in Stomach Cancer 5-Year Survival Did Not Come from More People Found at Early Stages [M027]. Zenodo.
DOI: 10.5281/zenodo.22968793
YOI: https://www.yamagishiyuuki.com/yoi/M027
ORCID: 0009-0006-8587-3450
PDF (English) · PDF (Japanese) · Date proof of the English PDF (OpenTimestamps .ots) · SHA256SUMS
The record page for this paper (in Japanese, with the PDFs in each language and the date proof): YOI M027. This paper is a preprint and has not been peer reviewed.