Abstract
This paper asks whether, for prostate cancer, the rate of people newly found (incidence) and the rate of people who die (mortality) have moved in the same way. It sets side by side, on the same standard population (the 1985 Japanese model population), the age-standardized incidence from the Cancer Information Service tables (the three-prefecture series as the main series, with national estimates and the National Cancer Registry as checks) and age-standardized mortality (national), and compares ratios over periods, year-to-year changes, other sites, and ages. It claims no new mathematical theorem and no new law.
First, the Cancer Information Service death counts agree with the prostate deaths in Table 5.24 for 2016–2023 (13,429 in 2023), and the sums within the incidence and mortality tables agree (Section 3).
Second, this is the core of the paper. From 1985 to 2015, age-standardized incidence (three prefectures) rose from 14.2 to 59.5, 4.175-fold, while age-standardized mortality rose from 5.60 to 6.99, 1.249-fold. Mortality was highest in 2000 (8.63), and from 2000 to 2015 incidence rose 2.417-fold while mortality fell to 0.811 times (Section 4).
Third, the ratio of incidence growth to mortality growth (1985 to 2015) is largest for prostate, 3.342, among 20 sites in men. Next is thyroid at 2.660; for all sites it is 1.497 (Section 5).
Fourth, the correlation of year-to-year changes (1986–2015) is 0.174, and in 13 of 30 years incidence and mortality moved in opposite directions. Shuffling the order of mortality's year-to-year changes gives a correlation of 0.174 or more in a share of 0.182 (Section 4).
Fifth, by age (1990 to 2015), the incidence ratio in the national estimates ranges from 11.30-fold at ages 50–54 to 1.80-fold at 85 and over, while the mortality ratio stays at 0.97–1.56-fold. In the three prefectures too, the incidence ratio exceeds the mortality ratio at ages 60–84, while at 85 and over the two are almost the same (1.55-fold and 1.56-fold) (Section 6).
Sixth, what separates them is the number found, or the number who die. For prostate cancer, the movement of mortality cannot be read from the movement of incidence, nor the other way round.
Scope note: This paper claims no new mathematical theorem and no new law — age-standardized incidence and mortality are published by the Cancer Information Service; the paper only sets them side by side and compares them. This paper is a structural interpretation of the shape of numbers in published aggregate data, and is not medical advice, diagnosis, or a treatment recommendation. The author is not a physician. For decisions about individual health, consult a physician or medical institution. It is a preprint that has not been peer reviewed. It does not discuss the effectiveness of screening and neither recommends nor discourages it. It does not go into why incidence rose or why mortality fell (testing, diagnosis, treatment, population change, and so on). Incidence is for three prefectures and mortality is national — the Cancer Information Service recommends the three-prefecture series for examining incidence trends, and there is no mortality table for the three prefectures. That two different populations are set side by side is written in Section 7. Periods are split into 1985–2015 and 2016–2023 so as not to cross the 2016 change in counting (M032). It is not one person's likelihood or outlook. It does not compare regions. About the data: the Cancer Information Service tables are used following the citation forms and rules shown on the page; this paper's ratios and correlations were produced by processing them. The mortality table was protected for reading, so it was read from a copy opened read-only in Excel on this PC and saved again as xlsx (values unchanged; checked against death counts in Table 5.24). What the paper adds: setting incidence and mortality on the same standard population side by side and showing that from 2000 they moved in opposite directions, showing by the ratio of incidence growth to mortality growth that prostate is the furthest apart of 20 sites in men, and laying out how that gap differs by age.
1. Notation and question
- Age-standardized rates: age-standardized incidence and mortality for the 1985 Japanese model population in the Cancer Information Service tables (per 100,000). Incidence and mortality use the same standard population.
- Incidence series: the main series is the three prefectures (Yamagata, Fukui, and Nagasaki; regional registries for 1985–2015, the National Cancer Registry from 2016). As checks, national estimates (1975–2015) and the National Cancer Registry (2016–2023). Mortality series: national (1958–2024).
- Ratio: the value in the last year of a period ÷ the value in its first year. The ratio of incidence growth to mortality growth measures how far the two have moved apart.
- Year-to-year change: the natural logarithm of the year-on-year ratio.
Question: have prostate cancer incidence and mortality moved in the same way? If they moved apart, how far compared with other sites, and at which ages?
Observation 1.1: M025 showed that the year's deaths ÷ new cases is not a share of the same people, and saw that for prostate the ratio departs widely from 1 − 5-year survival. M032 showed that incidence counting changed in 2016. This paper looks at prostate incidence and mortality from the side of their movement across years.
2. Survey and design
Stated honestly: the design was set after seeing the tables.
| Content | |
|---|---|
| Incidence | Cancer Information Service: three-prefecture high-quality regional observed data and National Cancer Registry (1985–2023), national estimates (1975–2015), National Cancer Registry (2016–2023) |
| Mortality | Cancer Information Service national cancer mortality data (1958–2024). Checked against Vital Statistics Table 5.24 |
| Yardsticks | Ratios over periods, ratio of incidence growth to mortality growth, correlation of year-to-year changes, ratios by age |
| Expectation and what was measured | Before the survey the expectation was that the incidence ratio by age would be larger at younger ages and larger than the mortality ratio at every age. This held in the national estimates, but in the three prefectures incidence at ages 50–59 in 1990 was under 10 cases, so no ratio could be given, and at 85 and over the incidence and mortality ratios were almost the same |
3. Data and checks
Calculation 3.1 The 7 retrieved files (including the re-saved copy) were fixed by SHA-256, and the following was checked.
- Prostate deaths (men, all ages) in the Cancer Information Service mortality table = prostate deaths in Table 5.24 (2016–2023; 13,429 in 2023).
- Prostate crude mortality in the mortality table = deaths ÷ population × 100,000 (2015; deaths 11,326; population 61,022,756).
- "All ages" of prostate cases in the three prefectures = the sum of the age columns (300 in 1990, 2,137 in 2015).
- The table page contains the English citation form for the mortality data.
4. How incidence and mortality moved
Calculation 4.1 Age-standardized incidence and mortality for prostate cancer (1985 model population, per 100,000)
| Year | Incidence (three prefectures) | Incidence (national) | Mortality (national) | Three-prefecture incidence ÷ mortality |
|---|---|---|---|---|
| 1985 | 14.2 | 12.2 | 5.60 | 2.55 |
| 1990 | 14.2 | 13.4 | 5.97 | 2.37 |
| 1995 | 19.0 | 18.1 | 7.73 | 2.45 |
| 2000 | 24.6 | 22.9 | 8.63 | 2.85 |
| 2005 | 52.7 | 41.8 | 8.52 | 6.19 |
| 2010 | 63.4 | 55.5 | 7.98 | 7.94 |
| 2015 | 59.5 | 62.0 | 6.99 | 8.51 |
| 2016 | 69.7 | 68.3 | 7.06 | 9.88 |
| 2019 | 64.3 | 68.2 | 6.74 | 9.53 |
| 2023 | 67.0 | 71.5 | 6.51 | 10.29 |
National incidence is from the national estimates up to 2015 and from the National Cancer Registry from 2016.
Calculation 4.2 Ratios over periods
| Period | Incidence (three prefectures) | Incidence (national) | Mortality (national) | Incidence (three prefectures) ÷ mortality |
|---|---|---|---|---|
| 1985 to 2000 | 1.727 | 1.875 | 1.541 | 1.121 |
| 2000 to 2015 | 2.417 | 2.707 | 0.811 | 2.983 |
| 1985 to 2015 | 4.175 | 5.078 | 1.249 | 3.342 |
| 2016 to 2023 | 0.961 | 1.047 | 0.922 | — |
Observation 4.3: From 1985 to 2015, incidence (three prefectures) rose 4.175-fold and mortality 1.249-fold. Mortality was highest in 2000 (8.63), and from then to 2015 incidence (three prefectures) rose 2.417-fold while mortality fell to 0.811 times. In the national estimates too, incidence rose 2.707-fold over the same 2000–2015. Three-prefecture incidence was highest in 2016 (69.7), and three-prefecture incidence ÷ mortality went from 2.55 in 1985 to 10.29 in 2023.
Observation 4.4: The correlation of year-to-year changes over 1986–2015 is 0.174, and in 13 of 30 years incidence and mortality moved in opposite directions. Shuffling the order of mortality's year-to-year changes 2000 times gives a correlation of 0.174 or more in a share of 0.182. The year-to-year movements are linked no more than a random order would be.
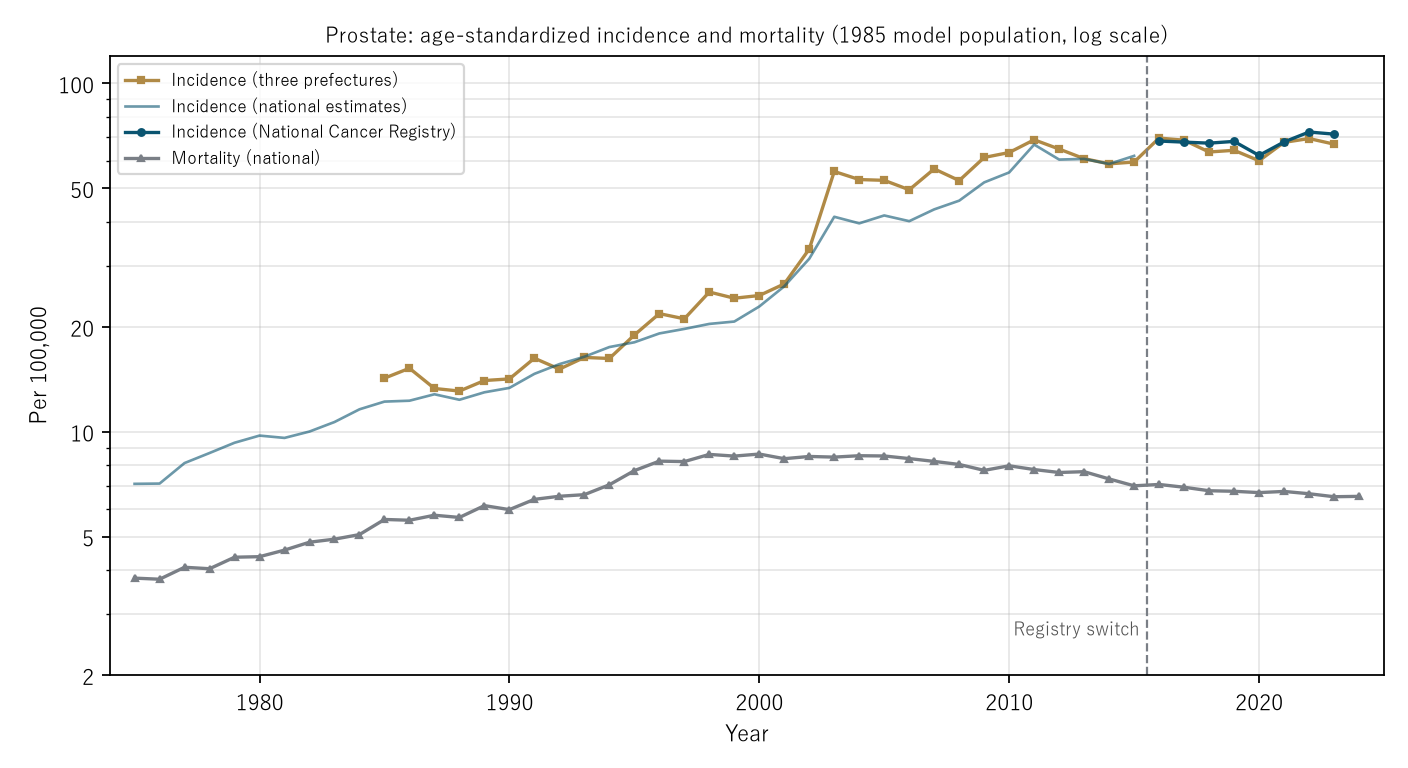
Figure 1: Age-standardized incidence and mortality for prostate cancer (1985 model population, log scale). Gold: incidence (three prefectures); thin navy: incidence (national estimates); thick navy: incidence (National Cancer Registry); grey: mortality (national). The dashed line marks the registry switch.
5. Core — comparing with other sites
Calculation 5.1 Ratios from 1985 to 2015 for 20 sites in men (incidence: three prefectures; mortality: national), in order of the ratio of incidence growth to mortality growth.
| Site | Incidence ratio | Mortality ratio | Incidence ÷ mortality |
|---|---|---|---|
| Prostate | 4.175 | 1.249 | 3.342 |
| Thyroid | 2.230 | 0.839 | 2.660 |
| Larynx | 0.907 | 0.432 | 2.099 |
| Malignant lymphoma | 1.895 | 0.969 | 1.955 |
| Skin | 1.487 | 0.782 | 1.902 |
| Esophagus | 1.416 | 0.805 | 1.760 |
| Kidney and urinary tract (excl. bladder) | 2.563 | 1.491 | 1.719 |
| Rectum | 1.499 | 0.895 | 1.675 |
| Stomach | 0.642 | 0.388 | 1.653 |
| Colorectum | 1.717 | 1.054 | 1.628 |
| Colon | 1.900 | 1.187 | 1.600 |
| Multiple myeloma | 1.104 | 0.865 | 1.277 |
| Leukemia | 1.020 | 0.803 | 1.270 |
| Lung | 1.129 | 0.944 | 1.196 |
| Liver | 0.583 | 0.539 | 1.082 |
| Pancreas | 1.170 | 1.106 | 1.058 |
| Oral cavity and pharynx | 1.568 | 1.552 | 1.010 |
| Gallbladder and bile ducts | 0.803 | 0.796 | 1.009 |
| Brain and CNS | 1.240 | 1.471 | 0.843 |
| Bladder | 0.836 | 1.043 | 0.802 |
| All sites | 1.145 | 0.765 | 1.497 |
Observation 5.2: The ratio of incidence growth to mortality growth is largest for prostate, 3.342. Next are thyroid at 2.660 and larynx at 2.099; all sites are 1.497. Prostate also ranks first of the 20 sites in incidence ratio (4.175; second is kidney and urinary tract at 2.563). Its mortality ratio (1.249) ranks fourth, the first being oral cavity and pharynx at 1.552. The size of the gap comes from the incidence side.
6. By age
Calculation 6.1 Incidence and mortality rates by age, 1990 to 2015 (incidence: national estimates and three prefectures; mortality: national). For ages 50–54 and 55–59, where three-prefecture incidence in 1990 was under 10 cases, no three-prefecture ratio is given.
| Age | Incidence (national estimates) | Incidence (three prefectures) | Mortality (national) |
|---|---|---|---|
| 50–54 | 2.0 → 22.5 (11.30×) | — | 0.58 → 0.68 (1.18×) |
| 55–59 | 6.4 → 68.4 (10.73×) | — | 2.41 → 2.51 (1.04×) |
| 60–64 | 24.4 → 168.3 (6.88×) | 25.9 → 162.2 (6.27×) | 7.57 → 7.49 (0.99×) |
| 65–69 | 40.8 → 327.1 (8.02×) | 47.4 → 344.6 (7.26×) | 13.38 → 15.92 (1.19×) |
| 70–74 | 89.8 → 524.1 (5.84×) | 95.6 → 496.7 (5.20×) | 35.21 → 34.08 (0.97×) |
| 75–79 | 154.2 → 583.6 (3.78×) | 183.2 → 551.9 (3.01×) | 65.44 → 69.69 (1.06×) |
| 80–84 | 232.6 → 542.5 (2.33×) | 223.3 → 537.1 (2.41×) | 118.06 → 135.53 (1.15×) |
| 85+ | 264.7 → 475.6 (1.80×) | 232.1 → 358.8 (1.55×) | 183.57 → 286.72 (1.56×) |
Observation 6.2: In the national estimates, the incidence ratio is largest at ages 50–54, 11.30-fold, and smallest at 85 and over, 1.80-fold. The mortality ratio stays at 0.97–1.56-fold at every age. In the national estimates, the incidence ratio exceeds the mortality ratio in all 8 age groups. In the three prefectures too, the incidence ratio exceeds the mortality ratio in the 5 groups from 60 to 84, while at 85 and over they are almost the same, 1.55-fold and 1.56-fold.
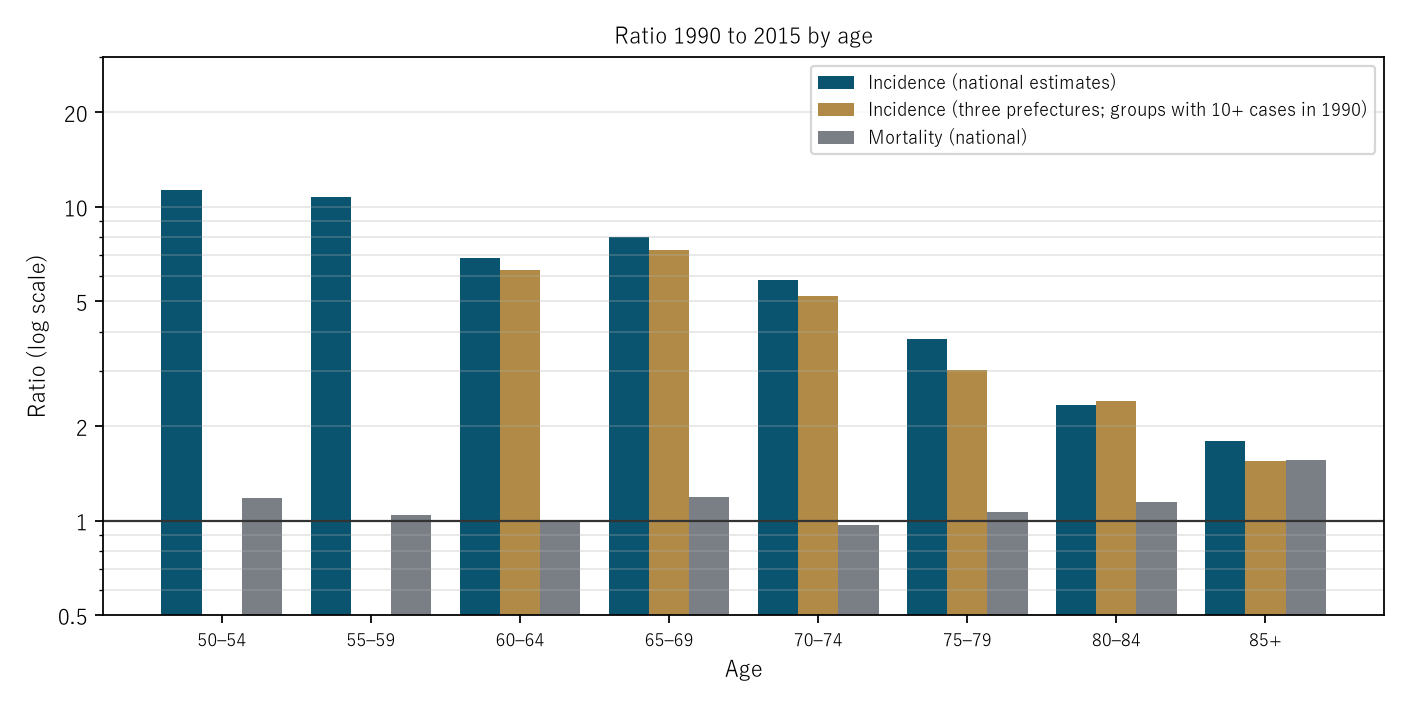
Figure 2: Ratios by age, 1990 to 2015 (log scale). Navy: incidence (national estimates); gold: incidence (three prefectures; groups with 10 or more cases in 1990); grey: mortality (national). The horizontal line is 1.
7. Limitations
- Incidence is for three prefectures and mortality is national. Two different populations are set side by side. The same direction was confirmed in the national estimates, but those differ in estimation method and included regions by year.
- It does not go into why incidence rose or why mortality fell. It does not discuss the effectiveness of screening either.
- No comparison crosses the 2016 change in counting (M032).
- Younger ages in the three prefectures have few cases. Ages 50–59 in 1990 had fewer than 10, and no ratio is given.
- It is not one person's likelihood or outlook. It does not compare regions.
Conclusion
Age-standardized prostate cancer incidence rose 4.175-fold from 1985 to 2015, while age-standardized mortality rose 1.249-fold. Mortality peaked in 2000 and fell, while incidence kept rising. The ratio of incidence growth to mortality growth, 3.342, was the largest of 20 sites in men, and year-to-year movements were hardly linked. By age, the incidence ratio was larger at younger ages, and the mortality ratio was small at every age.
One thing separates them — the number found, or the number who die.
When hearing that "prostate cancer is increasing," check together whether it is about the number of people found or the number of people who die.
Data and reproduction
| Data | Four tables from "Cancer Statistics," Cancer Information Service, National Cancer Center, Japan (national cancer mortality 1958–2024; three-prefecture incidence 1985–2023; national estimates 1975–2015; National Cancer Registry 2016–2023) and Vital Statistics 2024, Volume 1, Table 5.24 (retrieved 25–26 September 2026) |
| Citation form | Cancer Statistics. Cancer Information Service, National Cancer Center, Japan (Vital Statistics of Japan; Monitoring of Cancer Incidence in Japan (MCIJ); National Cancer Registry, Ministry of Health, Labour and Welfare). The English citations are Hori et al. (2015), Tanaka et al. (2026), and the Cancer Information Service entry in the references |
| Scope | Japan (national) and the three prefectures of Yamagata, Fukui, and Nagasaki, 1985–2023 |
| Verification | 検算/M034.py (--zu also writes the figures). Every number in the text is taken from 検算/M034_output.txt |
| Raw data | The 7 retrieved files (including the re-saved copy) and SOURCES.md (URLs, retrieval dates, SHA-256, rules of use, copies of notes, the re-saving procedure, definitions and calculation) in data/ |
| Figures | 図/M034_zu1, 図/M034_zu2 (png, svg, English versions) |
References
- Hori, M., Matsuda, T., Shibata, A., Katanoda, K., Sobue, T., & Nishimoto, H. (2015). Cancer incidence and incidence rates in Japan in 2009: a study of 32 population-based cancer registries for the Monitoring of Cancer Incidence in Japan (MCIJ) project. Japanese Journal of Clinical Oncology. 10.1093/jjco/hyv088
- Ministry of Health, Labour and Welfare. Vital Statistics 2024 (final data), Volume 1, Table 5.24 (in Japanese). e-Stat (accessed 26 September 2026). https://www.e-stat.go.jp/
- National Cancer Center Japan, Cancer Information Service. Cancer Statistics: tables cancer_mortality(1958-2024).xls (Vital Statistics of Japan), cancer_incidence3pref(1985-2023).xls, cancer_incidence(1975-2015).xls (Monitoring of Cancer Incidence in Japan), and cancer_incidenceNCR(2016-2023).xls (National Cancer Registry, Ministry of Health, Labour and Welfare) (in Japanese; accessed 26 September 2026). https://ganjoho.jp/reg_stat/statistics/data/dl/index.html
- Tanaka, H., Arai, K., & Katanoda, K. (2026). Updated Trends in Cancer Statistics in Japan: Incidence in 1985–2021 in selected prefectures and Mortality in 1979–2023—Beyond the Launch of the National Cancer Registry in 2016. Journal of Epidemiology. 10.2188/jea.JE20250559
- Yamagishi, Y. (2026). The Year's Deaths Divided by Its New Cases (the MI Ratio) Is Not a Share of the Same People — Against 1 − 5-Year Survival It Is 0.97 Times for Pancreas and 3.07 Times for Prostate [M025]. Zenodo. https://doi.org/10.5281/zenodo.22968532
- Yamagishi, Y. (2026). The Year Cancer Incidence Jumped, 2016, Is the Year the Registry System Changed — Age-Standardized Incidence Rose 1.089-Fold Nationally and 1.176-Fold in Three Prefectures in One Year, and in the Three Prefectures All 17 Sites Rose Together [M032]. Zenodo. https://doi.org/10.5281/zenodo.22972789
Reference
Yamagishi, Y. (2026). For Prostate Cancer, the Number Found and the Number Who Die Moved Separately [M034]. Zenodo.
DOI: 10.5281/zenodo.22972924
YOI: https://www.yamagishiyuuki.com/yoi/M034
ORCID: 0009-0006-8587-3450
PDF (English) · PDF (Japanese) · Date proof of the English PDF (OpenTimestamps .ots) · SHA256SUMS
The record page for this paper (in Japanese, with the PDFs in each language and the date proof): YOI M034. This paper is a preprint and has not been peer reviewed.