Abstract
This paper asks by which types of heart disease and at which ages the sudden fall in heart disease deaths in the mid-1990s should be seen. The new death certificate (postmortem certificate) that came into force in January 1995 added an instruction which, in the author's translation, reads: "In the cause-of-death section, do not write heart failure, respiratory failure, and the like as the terminal state of a disease." Using Vital Statistics yearly deaths by cause (Table 5.12), the breakdown of heart disease (Table 5.28), and deaths by age (Table 5.15), the paper measures the years around it. It claims no new mathematical theorem and no new law.
First, heart disease deaths agree across the three tables (165,478 in 1990; 139,206 in 1995), and the Ministry of Health, Labour and Welfare's special report and the note to Table 5.12 say that the fall in heart disease in 1994 (Heisei 6) "is considered to be due to the advance notice" of the instruction (Section 3).
Second, heart disease deaths went from 180,297 in 1993 to 159,579 in 1994 and 139,206 in 1995, 0.772 times over two years. The year-on-year ratios of 0.885 (1994) and 0.872 (1995) are the smallest and second smallest in 1951–2024. The year-on-year ratio of total deaths was 0.997 in 1994 and 1.053 in 1995 (Section 4).
Third, this is the core of the paper. From 1990 to 1995, of the 7 types of heart disease only heart failure fell, from 96,078 to 36,179, 0.377 times. The other 6 all rose: acute myocardial infarction 1.645-fold and arrhythmia and conduction disorders 2.022-fold. The share of heart failure in heart disease went from 0.581 to 0.260 (Section 5).
Fourth, the share of heart disease among all deaths fell from 1990 to 1995 in all 11 age groups from 40 to 94, most at ages 90–94, 0.680 times. From 1985 to 1990 the same share had moved by 0.982–1.101 times (Section 6).
Fifth, in the same 1995, cerebrovascular disease deaths rose by a year-on-year ratio of 1.219, the largest in 1951–2024. Heart failure deaths later reached 98,814 in 2024, exceeding 1990 (Sections 4 and 5).
Sixth, what separates them is how deaths are written, or disease. The step in heart disease in 1994–1995 coincides with the years in which the rule for writing death certificates changed, and only one type, heart failure, fell.
Scope note: This paper claims no new mathematical theorem and no new law — deaths by cause are published by Vital Statistics; the paper only compares the years before and after. This paper is a structural interpretation of the shape of numbers in published aggregate data, and is not medical advice, diagnosis, or a treatment recommendation. The author is not a physician. For decisions about individual health, consult a physician or medical institution. It is a preprint that has not been peer reviewed. It does not evaluate the people who write death certificates — the paper deals only with the overlap between a change in the rule for writing and the movement of the numbers. It does not split the step into a part due to writing and a part due to disease. The Ministry writes that the 1994 fall "is considered to be" due to the advance notice of the instruction, and this paper cites that. In 1995 the content of heart disease (which diseases it includes) also changed in part (note to Table 5.28), and that is also in the numbers. Which causes the deaths no longer written as heart failure went to cannot be fixed from the tables. It is not one person's likelihood. It does not compare regions. About the data: Vital Statistics on e-Stat is used under the Public Data License (Version 2.0); this paper's year-on-year ratios, ratios, and shares were produced by processing it. The Ministry's special report pages are only quoted; no numbers are taken from them. Quotations from Japanese sources are the author's translations. What the paper adds: showing with yearly numbers that the step splits over two years, 1994 and 1995, each the largest fall since 1951, showing that of the 7 types only heart failure fell and all others rose, and showing, through shares of all deaths, that it fell at every age.
1. Notation and question
- Year-on-year ratio: a year's deaths ÷ the previous year's (Table 5.12, both sexes).
- Heart disease: "heart disease (excluding hypertensive)" in Table 5.12. According to the note to Table 5.28, heart disease up to 1994 includes pulmonary embolism and the like, and excludes rheumatic fever with heart involvement and the like.
- Types: the 7 types of heart disease in Table 5.28. This table has 5-year steps between 1990 and 1995, so types are seen as ratios from 1990 to 1995.
- Share of all deaths: for each age group in Table 5.15, deaths from heart disease (or cerebrovascular disease) ÷ deaths from all causes. It does not depend on population size.
Question: when, in which types, and at which ages did the mid-1990s fall in heart disease occur?
Observation 1.1: M020 showed that the leading cause of death changes with how the age structure is aligned, and M032 showed that cancer incidence jumped in the year counting changed. This paper looks at the side of how causes of death are counted — a step that coincides with a change in the rule for writing death certificates.
2. Survey and design
Stated honestly: the design was set after seeing the tables and the original source.
| Content | |
|---|---|
| Yearly deaths by cause | Vital Statistics 2024, Volume 1, Table 5.12 (cause-of-death trend classification, every year 1899–2024) |
| Breakdown of heart disease | Same, Table 5.28 (every 5 years for 1950–2005) |
| By age | Same, Table 5.15 (five-year age groups, every 5 years for 1950–2000) |
| Original source | Vital Statistics special report "Overview of heart disease and cerebrovascular disease mortality statistics" (Ministry of Health, Labour and Welfare, released 9 March 2006) |
| Expectation and what was measured | Before the survey the author remembered the step as "1995." The original source says the effect of the instruction was in 1994 (Heisei 6), and yearly numbers show large falls in two consecutive years, 1994 and 1995 |
3. Data and checks
Calculation 3.1 The 6 retrieved files were fixed by SHA-256, and the following was checked.
- Table 5.12 has 17 cause columns (including total deaths) for every year 1899–2024.
- Heart disease in Table 5.12 = Table 5.28 = Table 5.15 (1990, 1995, 2000; 165,478 in 1990, 139,206 in 1995).
- In Table 5.15, the sum of the age columns (including unknown) = the total (all causes and heart disease, 1985–2000).
- In Table 5.28, the sum of the 7 types does not exceed total heart disease (161,523 in 1990, leaving 3,955 other heart disease; 136,160 in 1995, leaving 3,046).
- The special report pages contain the following sentences (author's translation): "The fall in heart disease in Heisei 6 is considered to be due to the advance notice of the instruction 'In the cause-of-death section, do not write heart failure, respiratory failure, and the like as the terminal state of a disease' in the new death certificate (postmortem certificate) (in force from 1 January Heisei 7)." "'Heart failure' fell greatly in all age groups in Heisei 6 for both men and women and has since been flat." "'Acute myocardial infarction,' which had been flat for both men and women, rose once in Heisei 6 and then fell."
4. Yearly deaths
Calculation 4.1 Deaths by cause (Table 5.12, both sexes, 1990–1998)
| Year | Total deaths | Heart disease | Cerebrovascular disease | Pneumonia | Malignant neoplasms |
|---|---|---|---|---|---|
| 1990 | 820,305 | 165,478 | 121,944 | 68,194 | 217,413 |
| 1991 | 829,797 | 168,878 | 118,448 | 70,057 | 223,727 |
| 1992 | 856,643 | 175,546 | 118,058 | 74,274 | 231,917 |
| 1993 | 878,532 | 180,297 | 118,794 | 81,138 | 235,707 |
| 1994 | 875,933 | 159,579 | 120,239 | 83,354 | 243,670 |
| 1995 | 922,139 | 139,206 | 146,552 | 79,629 | 263,022 |
| 1996 | 896,211 | 138,229 | 140,366 | 70,971 | 271,183 |
| 1997 | 913,402 | 140,174 | 138,697 | 78,904 | 275,413 |
| 1998 | 936,484 | 143,120 | 137,819 | 79,952 | 283,921 |
Observation 4.2: The year-on-year ratio of heart disease is 0.885 in 1994 and 0.872 in 1995, the smallest (1995) and second smallest (1994) in 1951–2024. The third is 0.895 in 1958, and in 1986–1993 the ratio ranged 0.993–1.097. Over the two years 1993–1995, heart disease went from 180,297 to 139,206, 0.772 times. The year-on-year ratio of total deaths was 0.997 in 1994 and 1.053 in 1995, a movement separate from the fall in heart disease.
Observation 4.3: From 1993 to 1994, total deaths fell by 2,599. Of the 15 causes in the table, the fall in heart disease (20,718) is larger than the falls of all other falling causes combined. Rises included malignant neoplasms (7,963), pneumonia (2,216), and cerebrovascular disease (1,445), and deaths outside the listed causes also rose by 4,302. Which causes the deaths no longer written as heart failure went to cannot be fixed from this table.
Observation 4.4: From 1994 to 1995, cerebrovascular disease rose by 26,313, and its year-on-year ratio of 1.219 is the largest in 1951–2024. In the same year heart disease fell by 20,373.
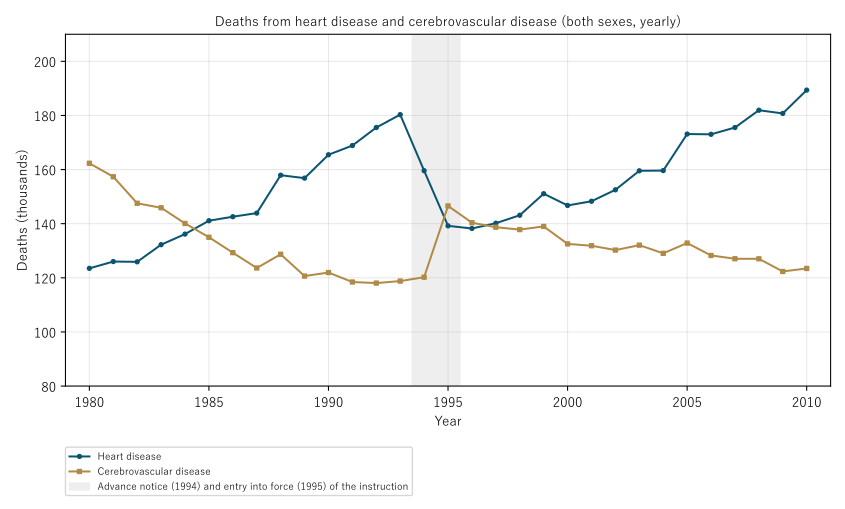
Figure 1: Deaths from heart disease and cerebrovascular disease (both sexes, yearly, thousands). The grey band covers the two years of the advance notice (1994) and entry into force (1995) of the instruction.
5. Core — only heart failure fell
Calculation 5.1 Deaths by type of heart disease (Table 5.28, both sexes)
| Type | 1985 | 1990 | 1995 | 2000 | 2024 | 1990 to 1995 |
|---|---|---|---|---|---|---|
| Chronic rheumatic heart disease | 1,644 | 1,360 | 2,755 | 2,522 | 1,893 | 2.026× (+1,395) |
| Acute myocardial infarction | 30,558 | 31,933 | 52,533 | 45,885 | 28,237 | 1.645× (+20,600) |
| Other ischemic heart disease | 18,926 | 19,504 | 23,040 | 24,298 | 39,357 | 1.181× (+3,536) |
| Chronic non-rheumatic endocardial disease | 3,554 | 4,201 | 5,357 | 5,995 | 11,522 | 1.275× (+1,156) |
| Cardiomyopathy | 1,417 | 2,097 | 3,455 | 3,303 | 3,297 | 1.648× (+1,358) |
| Arrhythmia and conduction disorders | 4,977 | 6,350 | 12,841 | 15,097 | 35,964 | 2.022× (+6,491) |
| Heart failure | 75,310 | 96,078 | 36,179 | 46,460 | 98,814 | 0.377× (−59,899) |
| Heart disease (total) | 141,097 | 165,478 | 139,206 | 146,741 | 226,388 | 0.841× (−26,272) |
Observation 5.2: From 1990 to 1995, of the 7 types of heart disease only heart failure fell, from 96,078 to 36,179, 0.377 times (down 59,899). The other 6 all rose, by 34,536 in total. Acute myocardial infarction rose 1.645-fold (up 20,600), arrhythmia and conduction disorders 2.022-fold, and cardiomyopathy 1.648-fold. The share of heart failure in heart disease went from 0.581 in 1990 to 0.260 in 1995, and is 0.436 in 2024.
Observation 5.3: Heart failure deaths kept rising from 36,179 in 1995, and 98,814 in 2024 exceeds 96,078 in 1990. Heart failure has continued to be written as a cause of death after the instruction.
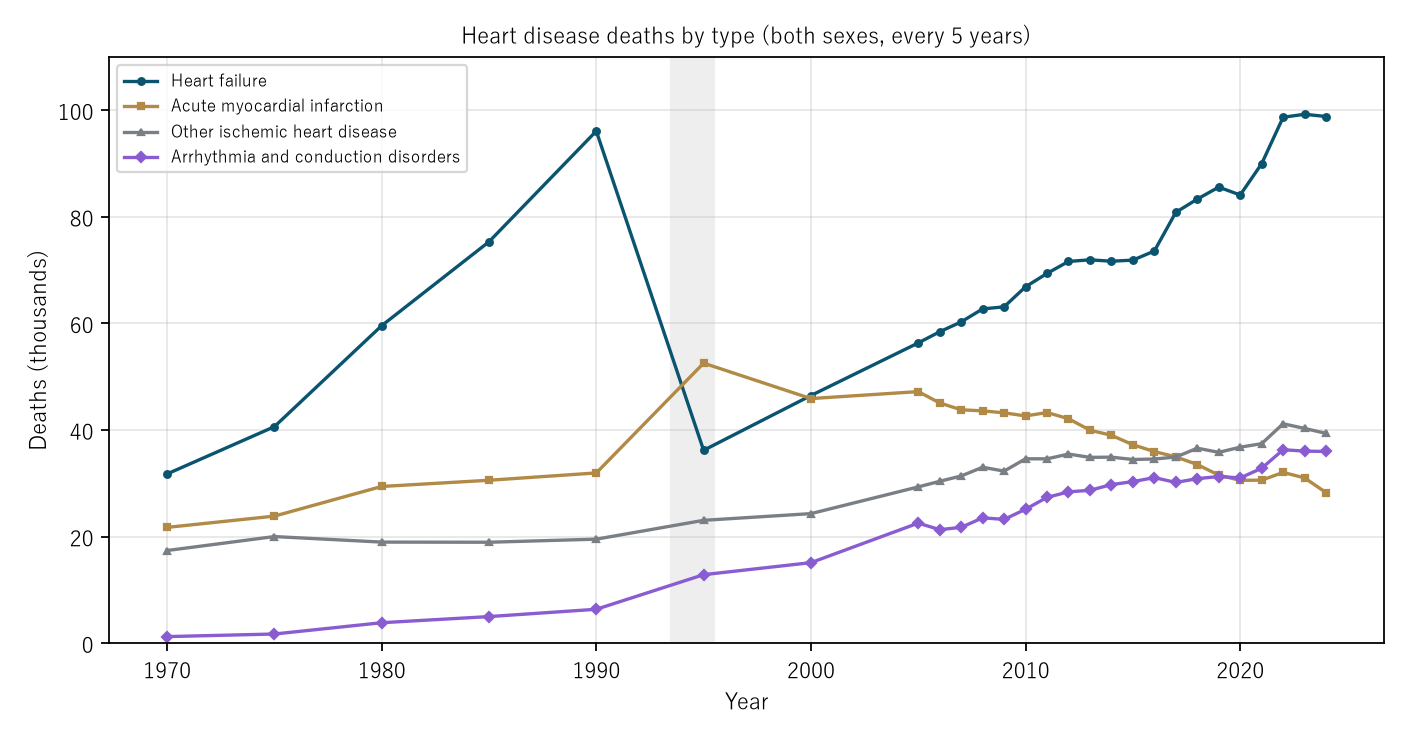
Figure 2: Deaths by type of heart disease (both sexes, thousands). Navy: heart failure; gold: acute myocardial infarction; grey: other ischemic heart disease; purple: arrhythmia and conduction disorders. The grey band is 1994–1995. This table has 5-year steps up to 2005.
6. By age
Calculation 6.1 Share of heart disease among all deaths (Table 5.15, both sexes)
| Age | 1985 | 1990 | 1995 | 2000 | 1990 to 1995 | 1985 to 1990 | Cerebrovascular share, 1990 to 1995 |
|---|---|---|---|---|---|---|---|
| 40–44 | 0.120 | 0.130 | 0.104 | 0.109 | 0.803× | 1.079× | 0.869× |
| 45–49 | 0.125 | 0.135 | 0.109 | 0.108 | 0.809× | 1.079× | 0.903× |
| 50–54 | 0.126 | 0.137 | 0.105 | 0.110 | 0.763× | 1.092× | 0.903× |
| 55–59 | 0.135 | 0.138 | 0.116 | 0.111 | 0.837× | 1.025× | 0.982× |
| 60–64 | 0.153 | 0.151 | 0.119 | 0.122 | 0.790× | 0.985× | 0.993× |
| 65–69 | 0.172 | 0.169 | 0.128 | 0.125 | 0.760× | 0.982× | 1.007× |
| 70–74 | 0.192 | 0.192 | 0.145 | 0.135 | 0.757× | 1.000× | 1.010× |
| 75–79 | 0.209 | 0.219 | 0.162 | 0.155 | 0.739× | 1.050× | 1.025× |
| 80–84 | 0.227 | 0.241 | 0.176 | 0.170 | 0.729× | 1.060× | 1.083× |
| 85–89 | 0.240 | 0.257 | 0.183 | 0.189 | 0.711× | 1.069× | 1.095× |
| 90–94 | 0.243 | 0.268 | 0.182 | 0.195 | 0.680× | 1.101× | 1.176× |
Observation 6.2: The share of heart disease among all deaths fell from 1990 to 1995 in all 11 age groups from 40 to 94. It fell most at ages 90–94 (0.680 times) and least at ages 55–59 (0.837 times), and from age 60 up it fell more at older ages. From 1985 to 1990 the same share had moved by 0.982–1.101 times. The cerebrovascular share rose from 1990 to 1995 in 6 of the 11 groups (ages 65 and over).
7. Limitations
- It does not split the step into a part due to writing and a part due to disease. The Ministry writes that the 1994 fall "is considered to be" due to the advance notice of the instruction, and this paper only cites that.
- In 1995 the diseases included in heart disease also changed in part (note to Table 5.28). The 1995 fall includes that change as well.
- The tables by type and by age are every 5 years. Only the yearly Table 5.12 (without a breakdown by type) separates 1994 from 1995.
- Which causes the deaths no longer written as heart failure went to cannot be fixed.
- It does not evaluate the people who write death certificates. It is not one person's likelihood. It does not compare regions.
Conclusion
Heart disease deaths were 0.885 times the previous year in 1994 and 0.872 times in 1995, each the largest fall since 1951. Those two years are when a death certificate instruction — "do not write heart failure as the terminal state of a disease" — was announced and came into force. From 1990 to 1995, only heart failure among the types of heart disease fell, and all other types rose. The fall occurred at every age and was larger at older ages.
One thing separates them — how deaths are written, or disease.
When a long-term trend shows heart disease deaths suddenly falling in the mid-1990s, check together that the rule for writing causes of death changed in those years.
Data and reproduction
| Data | Vital Statistics 2024 (final data), Volume 1, Tables 5.12, 5.15, and 5.28 (e-Stat) and three pages of the Vital Statistics special report "Overview of heart disease and cerebrovascular disease mortality statistics" (Ministry of Health, Labour and Welfare) (retrieved 26 September 2026) |
| Terms of use | e-Stat follows the Public Data License (Version 2.0). The Ministry's website follows the Public Data Terms of Use (Version 1.0). This paper's year-on-year ratios, ratios, and shares were produced by processing these and are not figures produced by the government |
| Scope | Japan, 1950–2024 |
| Verification | 検算/M035.py (--zu also writes the figures). Every number in the text is taken from 検算/M035_output.txt |
| Raw data | The 6 retrieved files and SOURCES.md (URLs, retrieval dates, SHA-256, terms of use, copies of table notes and quoted sentences, definitions and calculation) in data/ |
| Figures | 図/M035_zu1, 図/M035_zu2 (png, svg, English versions) |
References
- Ministry of Health, Labour and Welfare (2006). Overview of heart disease and cerebrovascular disease mortality statistics, Vital Statistics special report (in Japanese; accessed 26 September 2026). https://www.mhlw.go.jp/toukei/saikin/hw/jinkou/tokusyu/sinno05/2.html
- Ministry of Health, Labour and Welfare. Vital Statistics 2024 (final data), Volume 1, Tables 5.12, 5.15, and 5.28 (in Japanese). e-Stat (accessed 26 September 2026). https://www.e-stat.go.jp/
- Yamagishi, Y. (2026). In 1950 the Leading Cause of Death Was Tuberculosis, but Adjusted to Today's Age Structure It Is Old Age, and Tuberculosis Is Fifth [M020]. Zenodo. https://doi.org/10.5281/zenodo.22968057
- Yamagishi, Y. (2026). The Year Cancer Incidence Jumped, 2016, Is the Year the Registry System Changed — Age-Standardized Incidence Rose 1.089-Fold Nationally and 1.176-Fold in Three Prefectures in One Year, and in the Three Prefectures All 17 Sites Rose Together [M032]. Zenodo. https://doi.org/10.5281/zenodo.22972789
Reference
Yamagishi, Y. (2026). Heart Disease Deaths Fell by More Than a Tenth in Each of Two Years, 1994 and 1995 [M035]. Zenodo.
DOI: 10.5281/zenodo.22973433
YOI: https://www.yamagishiyuuki.com/yoi/M035
ORCID: 0009-0006-8587-3450
PDF (English) · PDF (Japanese) · Date proof of the English PDF (OpenTimestamps .ots) · SHA256SUMS
The record page for this paper (in Japanese, with the PDFs in each language and the date proof): YOI M035. This paper is a preprint and has not been peer reviewed.