Abstract
This paper asks whether the "reversal year," in which cerebral infarction overtook intracerebral hemorrhage among cerebrovascular deaths, is the same when looking at death counts and at age-standardized death rates. It compares the reversal under three measures using the Vital Statistics breakdown of cerebrovascular disease (Table 5.27), and looks at the reversal by age using age-specific rates (10-year groups) from a Vital Statistics special report. It claims no new mathematical theorem and no new law.
First, the tables agree: the special report's rates by sex agree with those of Table 5.27 in 60 cells (1985 excluded, per the table note), and the sum of the types in Table 5.27 does not exceed cerebrovascular disease (Section 3).
Second, for men, infarction overtakes hemorrhage between 1975 and 1980 in deaths and crude death rates (estimated 1975.3) but between 1970 and 1975 in age-standardized death rates (estimated 1970.1): the 5-year interval differs. For women and both sexes, all three measures reverse between 1970 and 1975, but for women too the estimated year is 2.9 years earlier for the age-standardized rate (Section 4).
Third, this is the core of the paper. The reversal came earlier at older ages. For men the estimated year is 1965.8 at 90 and over, 1967.8 at 80–89, 1971.4 at 70–79, and 1984.2 at 60–69, and the three groups aged 59 and under do not reverse by 2004. Women follow the same order (Section 5).
Fourth, the 2015 model population used as the weights for the age-standardized rate has a share of 0.192 aged 70 and over. In the actual population the share was 0.047 in 1970 and 0.053 in 1975, so the model population's share is 3.61 times as large (against 1975). The age-standardized rate weighs heavily a reversal that happened first at older ages, and counts weigh it lightly (Section 4).
Fifth, at ages 60–69, hemorrhage exceeded infarction again after the reversal (men in 2004; women in 2000 and 2004). This is the only age group that went back after reversing (Section 5).
Sixth, what separates them is the weights of the age composition. "The year infarction overtook hemorrhage" shifts its 5-year interval depending on which age weights the two are compared with.
Scope note: This paper claims no new mathematical theorem and no new law — deaths, death rates, and age-standardized death rates by type are published by Vital Statistics; the paper only compares reversal years. This paper is a structural interpretation of the shape of numbers in published aggregate data, and is not medical advice, diagnosis, or a treatment recommendation. The author is not a physician. For decisions about individual health, consult a physician or medical institution. It is a preprint that has not been peer reviewed. It does not go into why intracerebral hemorrhage fell and cerebral infarction rose (blood pressure, diet, diagnosis, imaging, treatment, and so on). Changes in classification are also in the numbers — according to the note to Table 5.27, intracerebral hemorrhage up to 1978 includes non-traumatic intracranial hemorrhage. The definition is the same for counts and for age-standardized rates, so the gap between the two reversal years is not explained by a difference in definition. Reversal years are fixed only to 5-year intervals — the estimated year joins the two surrounding years with a straight line on the log scale and is not a year in the table. It is not one person's likelihood. It does not compare regions. About the data: Vital Statistics on e-Stat is used under the Public Data License (Version 2.0), and the Ministry's pages under the Public Data Terms of Use (Version 1.0); this paper's ratios, estimated years, and shares were produced by processing them. What the paper adds: showing that the same reversal changes its 5-year interval depending on the measure, giving reversal years by age and showing that they come earlier at older ages, and supporting the difference with the age composition of the model population and of the population at the time.
1. Notation and question
- Reversal: the interval between table years (5 years) in which infarction first exceeds hemorrhage.
- Estimated year: the year at which the natural logarithm of hemorrhage ÷ infarction reaches 0, assuming it moves in a straight line between the two surrounding years.
- Measures: deaths, crude death rates, and age-standardized death rates (2015 model population) (Table 5.27).
- By age: crude death rates by 10-year age group from Table 5 of the special report.
- Share aged 70 and over: for 1970 and 1975, from the population derived as deaths ÷ death rates in Table 5.15; for the 2015 model population, from Appendix Table 6.
Question: is the year infarction overtook hemorrhage the same by count, by crude rate, and by age-standardized rate? If not, what makes the difference?
Observation 1.1: M024 split the separate movements of cancer death counts and age-standardized rates as a push from the age composition. M035 showed that a step in heart disease deaths coincides with a change in how death certificates are written. This paper looks at how the ranking of two types within cerebrovascular disease changes with the weights of the age composition.
2. Survey and design
Stated honestly: the design was set after seeing the tables.
| Content | |
|---|---|
| By type | Vital Statistics 2024, Volume 1, Table 5.27 (breakdown of cerebrovascular disease; deaths, death rates, age-standardized death rates; every 5 years for 1951–2005) |
| By age | Vital Statistics special report "Overview of heart disease and cerebrovascular disease mortality statistics," Table 5 (10-year age groups, 1951–2004) |
| Age composition | Table 5.15 (population in 1970 and 1975) and Appendix Table 6 (2015 model population) |
| Expectation and what was measured | Before the survey the expectation was that the reversal year would be the same under every measure. For men the 5-year interval differed, and by age the reversal came earlier at older ages. Seeing the figure, the author also noticed that ages 60–69 went back after reversing, and had the checker count it |
3. Data and checks
Calculation 3.1 The 4 retrieved files were fixed by SHA-256, and the following was checked.
- Table 5.27 covers 31 years from 1951 to 2024 (every 5 years up to 2005). In every year the deaths from subarachnoid hemorrhage, intracerebral hemorrhage, and cerebral infarction sum to no more than cerebrovascular disease, and men + women = total.
- Table 5 of the special report has 64 series (sex × type × total and 7 age groups) for 1951–2004.
- The "total" rates in Table 5 of the special report = the death rates by sex in Table 5.27 (60 cells, 0 mismatches; 1985 excluded because, according to the table note, a different population was used).
4. Reversal by measure
Calculation 4.1 Interval and estimated year in which infarction overtook hemorrhage (Table 5.27)
| Sex, measure | Interval | Estimated year | Hemorrhage, infarction in the earlier year | Hemorrhage, infarction in the later year |
|---|---|---|---|---|
| Both sexes, deaths | 1970 to 1975 | 1974.3 | 85,518, 59,003 | 64,744, 68,547 |
| Both sexes, crude death rate | 1970 to 1975 | 1974.3 | 82.9, 57.2 | 58.2, 61.6 |
| Men, deaths | 1975 to 1980 | 1975.3 | 34,981, 34,130 | 26,785, 37,175 |
| Men, crude death rate | 1975 to 1980 | 1975.3 | 63.9, 62.4 | 46.8, 65 |
| Men, age-standardized death rate | 1970 to 1975 | 1970.1 | 360.9, 358 | 229.8, 359.1 |
| Women, deaths | 1970 to 1975 | 1973.4 | 38,654, 28,399 | 29,763, 34,417 |
| Women, crude death rate | 1970 to 1975 | 1973.4 | 73.6, 54.1 | 52.7, 60.9 |
| Women, age-standardized death rate | 1970 to 1975 | 1970.5 | 261.4, 248.9 | 168.1, 266.6 |
Observation 4.2: For men, the reversal occurs between 1975 and 1980 in deaths and crude death rates, and between 1970 and 1975 in age-standardized death rates. The estimated years, 1975.3 and 1970.1, are 5.3 years apart. In 1970 the age-standardized death rates were almost level: hemorrhage 360.9, infarction 358 (ratio 1.008). For women and both sexes, all three measures reverse between 1970 and 1975, but for women too the estimated year is 2.9 years earlier for the age-standardized rate. Under no measure does hemorrhage exceed infarction again after the reversal.
Observation 4.3: In the 2015 model population used as weights for the age-standardized rate, those aged 70 and over make up 0.192. In the actual population they were 0.047 in 1970 and 0.053 in 1975, so the model population's share is 3.61 times as large (against 1975). Deaths and crude rates compare the two types with the actual age composition of each year; the age-standardized rate compares them with a composition that has far more people aged 70 and over.
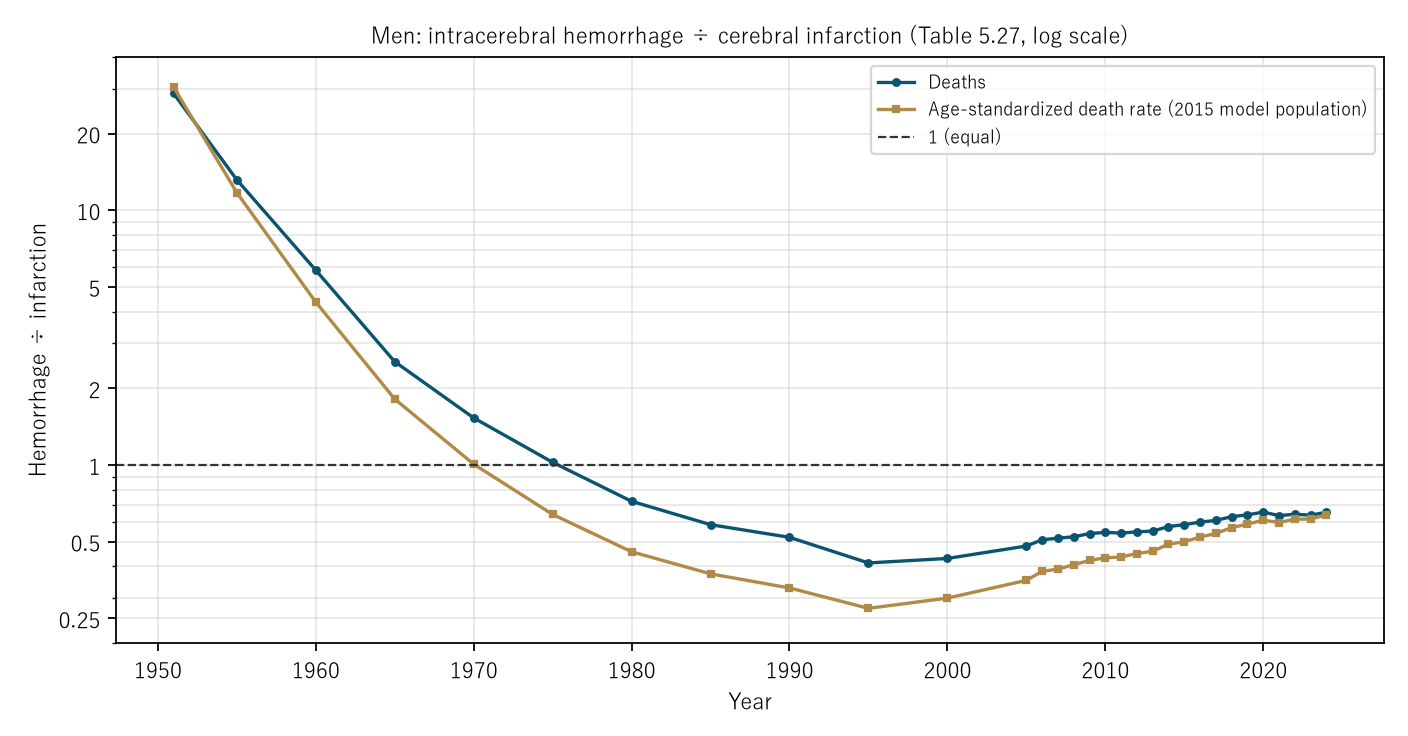
Figure 1: Men: intracerebral hemorrhage ÷ cerebral infarction (Table 5.27, log scale). Navy: deaths; gold: age-standardized death rate (2015 model population). The dashed line is 1. The gold line falls below 1 first.
5. Core — reversal by age
Calculation 5.1 Reversal by age (Table 5 of the special report, crude death rates)
| Sex, age | Interval | Estimated year | Years when hemorrhage exceeded infarction again afterwards |
|---|---|---|---|
| Men, 39 and under | No reversal through 2004 | — | — |
| Men, 40–49 | No reversal through 2004 | — | — |
| Men, 50–59 | No reversal through 2004 | — | — |
| Men, 60–69 | 1980 to 1985 | 1984.2 | 2004 |
| Men, 70–79 | 1970 to 1975 | 1971.4 | None |
| Men, 80–89 | 1965 to 1970 | 1967.8 | None |
| Men, 90 and over | 1965 to 1970 | 1965.8 | None |
| Women, 39 and under | No reversal through 2004 | — | — |
| Women, 40–49 | No reversal through 2004 | — | — |
| Women, 50–59 | No reversal through 2004 | — | — |
| Women, 60–69 | 1990 to 1995 | 1994.5 | 2000, 2004 |
| Women, 70–79 | 1970 to 1975 | 1972.4 | None |
| Women, 80–89 | 1965 to 1970 | 1968.8 | None |
| Women, 90 and over | 1965 to 1970 | 1966.0 | None |
Observation 5.2: The reversal came earlier at older ages. For men the estimated year is 1965.8 at 90 and over, 1967.8 at 80–89, 1971.4 at 70–79, and 1984.2 at 60–69; for women 1966.0, 1968.8, 1972.4, and 1994.5. In the four groups aged 60 and over, the older the group, the earlier the reversal, for both sexes. In the three groups aged 59 and under, hemorrhage remains larger through 2004 for both sexes (men aged 50–59 in 2004: hemorrhage 26.5, infarction 8.1).
Observation 5.3: At ages 60–69, hemorrhage exceeded infarction again after the reversal. For men in 2004 (hemorrhage 50.2, infarction 45.4), and for women in 2000 and 2004 (17.9 and 13.3 in 2004). At ages 70 and over, no group went back after reversing.
Observation 5.4: A reversal that happened first at older ages shows up early in the age-standardized rate, which compares with weights rich in people aged 70 and over, and late in death counts, which compare with the young age composition of the 1970s. The 5-year gap for men in Section 4 arises from the combination of these age-specific differences in reversal and the difference in the age composition of the weights.
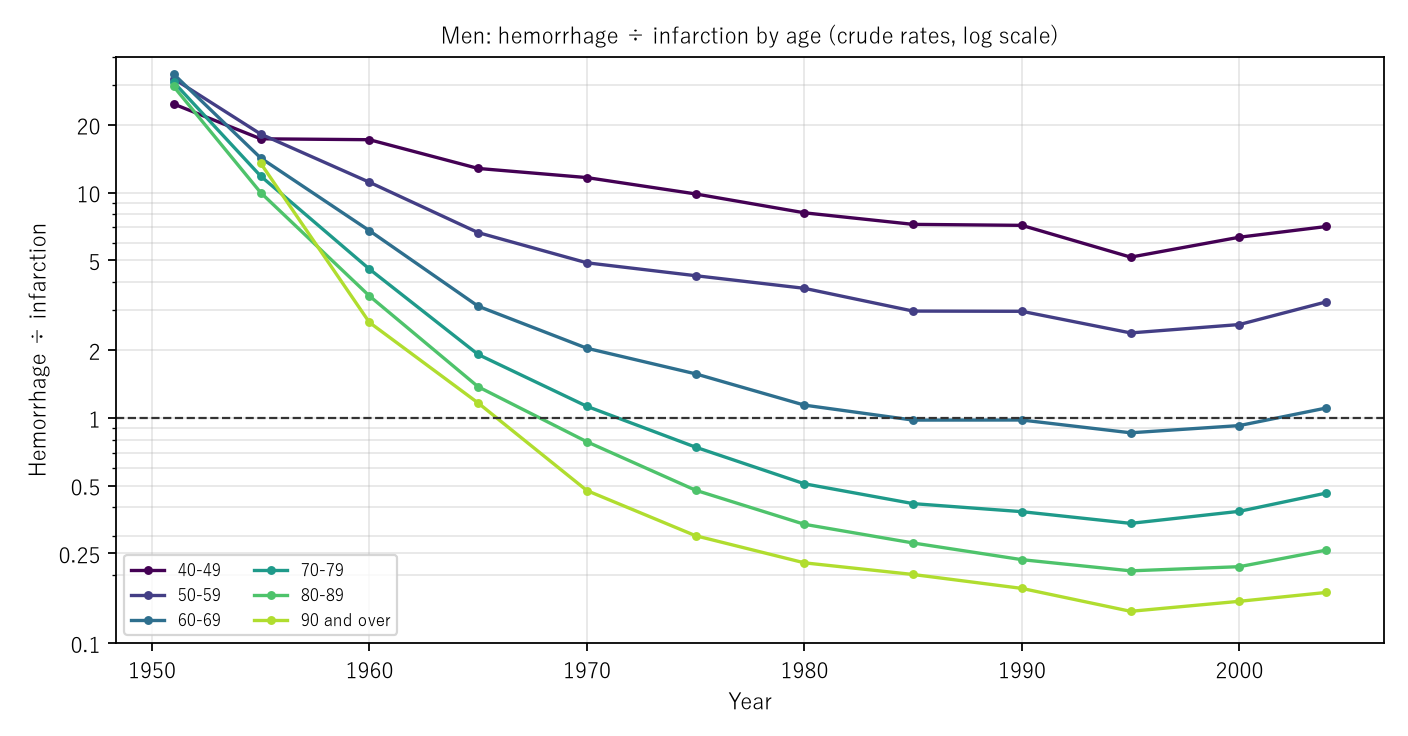
Figure 2: Men: intracerebral hemorrhage ÷ cerebral infarction by age (crude death rates, log scale). Lighter colors are older ages. The dashed line is 1. Lines for older ages fall below 1 first, and the lines for ages 59 and under do not fall below it.
Calculation 5.5 Deaths afterwards (Table 5.27, both sexes)
| Year | Cerebral infarction | Intracerebral hemorrhage | Subarachnoid hemorrhage |
|---|---|---|---|
| 1990 | 64,575 | 29,558 | 12,281 |
| 1995 | 89,431 | 33,187 | 14,424 |
| 2005 | 80,964 | 33,362 | 14,883 |
| 2024 | 56,129 | 32,566 | 11,070 |
Cerebral infarction deaths were highest in 1995 (89,431), the year of the step in heart disease shown in M035.
6. Limitations
- It does not go into why intracerebral hemorrhage fell and cerebral infarction rose.
- Intracerebral hemorrhage up to 1978 includes non-traumatic intracranial hemorrhage (table note). The definition is the same for counts and age-standardized rates, so it does not explain the gap between the two measures, but it can affect the reversal years themselves.
- The tables are every 5 years. Reversals are fixed only to 5-year intervals, and the estimated year joins the two surrounding years with a straight line.
- Age-specific rates are crude rates in 10-year groups.
- It is not one person's likelihood. It does not compare regions.
Conclusion
Cerebral infarction deaths overtook intracerebral hemorrhage, for men, between 1975 and 1980 by death count and between 1970 and 1975 by age-standardized death rate. The reversal came earlier at older ages and had not occurred at ages 59 and under by 2004. The 2015 model population used as weights for age standardization has 3.61 times the 1975 population's share aged 70 and over, and shows early a reversal that came first at older ages.
One thing separates them — the weights of the age composition.
When hearing that "cerebral infarction overtook intracerebral hemorrhage in such-and-such a year," check together whether it is about counts or age-standardized rates, and about which ages.
Data and reproduction
| Data | Vital Statistics 2024 (final data), Volume 1, Tables 5.27 and 5.15 and Appendix Table 6 (e-Stat), and Table 5 of the Vital Statistics special report "Overview of heart disease and cerebrovascular disease mortality statistics" (Ministry of Health, Labour and Welfare) (retrieved 26 September 2026) |
| Terms of use | e-Stat follows the Public Data License (Version 2.0). The Ministry's website follows the Public Data Terms of Use (Version 1.0). This paper's ratios, estimated years, and shares were produced by processing these and are not figures produced by the government |
| Scope | Japan, 1951–2024 |
| Verification | 検算/M036.py (--zu also writes the figures). Every number in the text is taken from 検算/M036_output.txt |
| Raw data | The 4 retrieved files and SOURCES.md (URLs, retrieval dates, SHA-256, terms of use, table notes, definitions and calculation) in data/ |
| Figures | 図/M036_zu1, 図/M036_zu2 (png, svg, English versions) |
References
- Ministry of Health, Labour and Welfare (2006). Overview of heart disease and cerebrovascular disease mortality statistics, Vital Statistics special report, Table 5 (in Japanese; accessed 26 September 2026). https://www.mhlw.go.jp/toukei/saikin/hw/jinkou/tokusyu/sinno05/13-5.html
- Ministry of Health, Labour and Welfare. Vital Statistics 2024 (final data), Volume 1, Tables 5.15 and 5.27 and Appendix Table 6 (in Japanese). e-Stat (accessed 26 September 2026). https://www.e-stat.go.jp/
- Yamagishi, Y. (2026). Cancer Deaths Rose While the Age-Adjusted Rate Fell — the Push from the Age Composition Ranges from 1.433 Times for Breast to 2.918 Times for Prostate [M024]. Zenodo. https://doi.org/10.5281/zenodo.22968432
- Yamagishi, Y. (2026). Heart Disease Deaths Fell by More Than a Tenth in Each of Two Years, 1994 and 1995 — The Years of an Instruction on the Death Certificate; Only Heart Failure Fell (0.377-Fold from 1990 to 1995), While Acute Myocardial Infarction Rose 1.645-Fold [M035]. Zenodo. https://doi.org/10.5281/zenodo.22973433
Reference
Yamagishi, Y. (2026). The Year Cerebral Infarction Deaths Overtook Intracerebral Hemorrhage Depends on Whether One Looks at Counts or at Age-Standardized Rates [M036]. Zenodo.
DOI: 10.5281/zenodo.22973792
YOI: https://www.yamagishiyuuki.com/yoi/M036
ORCID: 0009-0006-8587-3450
PDF (English) · PDF (Japanese) · Date proof of the English PDF (OpenTimestamps .ots) · SHA256SUMS
The record page for this paper (in Japanese, with the PDFs in each language and the date proof): YOI M036. This paper is a preprint and has not been peer reviewed.