Abstract
This paper asks how differently death rates rise with age for the three types of stroke — subarachnoid hemorrhage, intracerebral hemorrhage, and cerebral infarction — and whether that shape moved over the years. Using the national age-specific death rates in the Vital Statistics special report tables of age-standardized death rates by prefecture (nine editions, 1980–2020), it fits a straight line to ln(death rate) at ages 40–84 and measures, by type and sex, the same "doubling years" as in M002 and M019. It claims no new mathematical theorem and no new law.
First, the special report's national age-standardized death rates agree with Vital Statistics Table 5.27 in all 54 cells (9 years × 3 types × 2 sexes) (Section 3).
Second, for men in 2020, cerebral infarction doubles in 4.4 years, intracerebral hemorrhage in 9.5, and subarachnoid hemorrhage in 20.1; for women, 4.5, 8.1, and 11.9 years. The doubling time of subarachnoid hemorrhage is 4.61 times that of cerebral infarction for men and 2.65 times for women (Section 4).
Third, this is the core of the paper. The order "cerebral infarction < intracerebral hemorrhage < subarachnoid hemorrhage" holds in all nine years from 1980 to 2020, for both sexes. Men's cerebral infarction doubling time stayed within 3.9–4.4 years while its age-standardized death rate fell from 323.4 to 52.5, 0.162 times. Across the nine years, the longest doubling time for cerebral infarction (4.4 years for men, 4.5 for women) is shorter than the shortest for intracerebral hemorrhage (8.1 and 6.5 years) (Section 5).
Fourth, women's rates exceed men's only for subarachnoid hemorrhage. For subarachnoid hemorrhage in 2020, women exceed men in every age group from 65–69 up, reaching 2.04 times at 85–89. For intracerebral hemorrhage women are lower in every age group from 40, and for cerebral infarction women exceed men only at 95 and over. In age-standardized death rates too, women exceed men only for subarachnoid hemorrhage, in all nine years (Section 6).
Fifth, subarachnoid hemorrhage fits a straight line less well than the other two (smallest R² 0.866), and its doubling time varies across the nine years, 17.1–25.3 years for men (Section 5).
Sixth, what separates them is the age slope of each type. Stroke death rates fell greatly in 40 years, but how steeply each of the three types rises with age has hardly moved.
Scope note: This paper claims no new mathematical theorem and no new law — age-specific death rates by type are published in the Vital Statistics special report; the paper only fits straight lines to measure doubling years and sets them side by side. This paper is a structural interpretation of the shape of numbers in published aggregate data, and is not medical advice, diagnosis, or a treatment recommendation. The author is not a physician. For decisions about individual health, consult a physician or medical institution. It is a preprint that has not been peer reviewed. It does not go into why age slopes differ by type, or why women's subarachnoid hemorrhage is more common at older ages. These are one year's age-specific rates — they line up people born in different years and are not necessarily how the rate moves as one person ages (the distinction of M003). Prefecture rows are not used, and regions are not compared. It is not one person's likelihood. About the data: the Vital Statistics special report and Vital Statistics on e-Stat are used under the Public Data License (Version 2.0); this paper's doubling years and ratios were produced by processing them. What the paper adds: setting the doubling years of the three types of stroke side by side over nine years and showing that their order never changes, showing for each type that the age slope hardly moved while the level fell greatly, and showing that women exceed men only for subarachnoid hemorrhage at older ages.
1. Notation and question
- Doubling years: ln2 ÷ b, where b is the slope of a straight line fitted to ln(death rate) against age (middle of group − 62.5) over the nine five-year groups of ages 40–84. The same fit as M002 and M019. The fit is summarized by R².
- Women ÷ men: women's death rate ÷ men's death rate in the same age group.
- Nine years: 1980, 1985, …, 2020 (nine editions of the Vital Statistics special report on age-standardized death rates by prefecture; every edition uses the 2015 model population for age standardization).
Question: how differently do the three types of stroke double with age? Did those speeds move in 40 years? How do women and men differ?
Observation 1.1: M002 showed that the speed at which adult death rates double with age hardly moved, and what fell was the level. M019 showed that this speed is a mixture of different speeds by cause. M036 showed that cerebral infarction overtook intracerebral hemorrhage in different years at different ages. This paper separates speed and level for the three types within stroke.
2. Survey and design
Stated honestly: the design was set after seeing the tables.
| Content | |
|---|---|
| Age-specific death rates | Vital Statistics special report, age-standardized death rates by prefecture (2015 model population), Table 29 (subarachnoid hemorrhage), Table 30 (intracerebral hemorrhage), Table 31 (cerebral infarction); the "national" rows of nine editions, 1980–2020 |
| Check | Vital Statistics 2024, Volume 1, Table 5.27 age-standardized death rates |
| Yardsticks | Doubling years and R² at ages 40–84; women ÷ men |
| Expectation and what was measured | Before the survey the plan was to look only at 2020. Tables of the same form existed in nine editions every 5 years from 1980, so the movement of doubling years was measured too. The weak fit for subarachnoid hemorrhage was found then |
3. Data and checks
Calculation 3.1 The 28 retrieved files were fixed by SHA-256, and the following was checked.
- The type in the title of each of the 27 tables (9 years × 3 types) matches the type read.
- The special report's national age-standardized death rate = the age-standardized death rate in Table 5.27 (54 cells: 9 years × 3 types × 2 sexes).
- The national death rates at ages 40–84 contain no zeros.
4. Doubling years in 2020
Calculation 4.1 Years for the death rate to double with age in 2020 (ages 40–84) and age-standardized death rates (per 100,000)
| Type, sex | Doubling years | R² | Age-standardized death rate |
|---|---|---|---|
| Subarachnoid hemorrhage, men | 20.1 years | 0.962 | 7.1 |
| Subarachnoid hemorrhage, women | 11.9 years | 0.966 | 9.2 |
| Intracerebral hemorrhage, men | 9.5 years | 0.996 | 31.9 |
| Intracerebral hemorrhage, women | 8.1 years | 0.977 | 16.3 |
| Cerebral infarction, men | 4.4 years | 0.999 | 52.5 |
| Cerebral infarction, women | 4.5 years | 0.989 | 29.3 |
Observation 4.2: In 2020, for both sexes, cerebral infarction doubles fastest and subarachnoid hemorrhage slowest. For men, the doubling time of subarachnoid hemorrhage (20.1 years) is 4.61 times that of cerebral infarction (4.4 years); for women, 11.9 and 4.5 years, 2.65 times. Intracerebral hemorrhage and cerebral infarction lie well on a straight line (R² 0.977 or more).
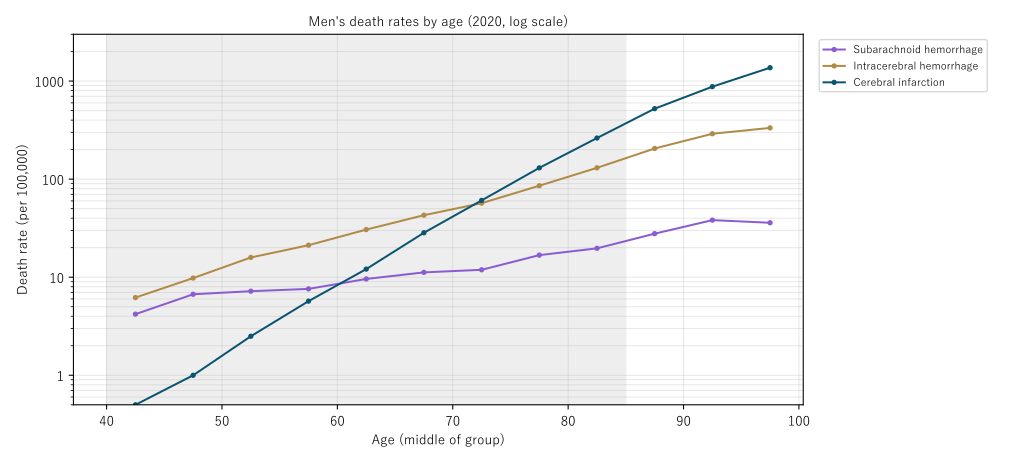
Figure 1: Men's death rates by age (2020, log scale). The grey band is ages 40–84 used for the fit. On a log vertical axis, doubling at a constant speed is a straight line, and a steeper line doubles faster.
5. Core — the level fell, the slope did not move
Calculation 5.1 Doubling years (1980–2020) and the ratio of age-standardized death rates from 1980 to 2020
| Type, sex | 1980 | 1985 | 1990 | 1995 | 2000 | 2005 | 2010 | 2015 | 2020 | Age-standardized death rate, 1980 to 2020 |
|---|---|---|---|---|---|---|---|---|---|---|
| Subarachnoid hemorrhage, men | 25.3 | 24.4 | 20.6 | 17.6 | 17.1 | 17.5 | 17.8 | 19.2 | 20.1 | 11.6 → 7.1 (0.612×) |
| Subarachnoid hemorrhage, women | 13.4 | 11.8 | 10.8 | 9.8 | 10.0 | 10.1 | 10.8 | 11.3 | 11.9 | 14 → 9.2 (0.657×) |
| Intracerebral hemorrhage, men | 8.1 | 8.6 | 9.0 | 8.4 | 8.6 | 8.7 | 8.9 | 9.0 | 9.5 | 147.7 → 31.9 (0.216×) |
| Intracerebral hemorrhage, women | 6.5 | 6.8 | 6.9 | 6.8 | 6.9 | 7.1 | 7.1 | 7.2 | 8.1 | 109.6 → 16.3 (0.149×) |
| Cerebral infarction, men | 3.9 | 4.0 | 4.0 | 4.0 | 4.1 | 4.2 | 4.2 | 4.4 | 4.4 | 323.4 → 52.5 (0.162×) |
| Cerebral infarction, women | 3.8 | 3.8 | 4.0 | 4.0 | 4.2 | 4.2 | 4.1 | 4.2 | 4.5 | 241.9 → 29.3 (0.121×) |
Observation 5.2: In all nine years and for both sexes, doubling years follow the order "cerebral infarction < intracerebral hemorrhage < subarachnoid hemorrhage," and the order never changes. Across the nine years, the longest doubling time for cerebral infarction (4.4 years for men, 4.5 for women) is shorter than the shortest for intracerebral hemorrhage (8.1 years for men, 6.5 for women).
Observation 5.3: Men's age-standardized death rate from cerebral infarction fell from 323.4 to 52.5, 0.162 times, but its doubling time moved only from 3.9 to 4.4 years (1.122 times). For intracerebral hemorrhage too, while the age-standardized death rate fell to 0.216 times for men and 0.149 times for women, the doubling time stayed within 8.1–9.5 years for men and 6.5–8.1 years for women. What fell was the level; the age slope hardly moved.
Observation 5.4: Subarachnoid hemorrhage's doubling time varies more than the other two, 17.1–25.3 years for men and 9.8–13.4 for women. Its smallest R² is 0.866, lower than 0.977 for intracerebral hemorrhage and cerebral infarction. The age shape of subarachnoid hemorrhage departs somewhat from doubling at a constant speed.
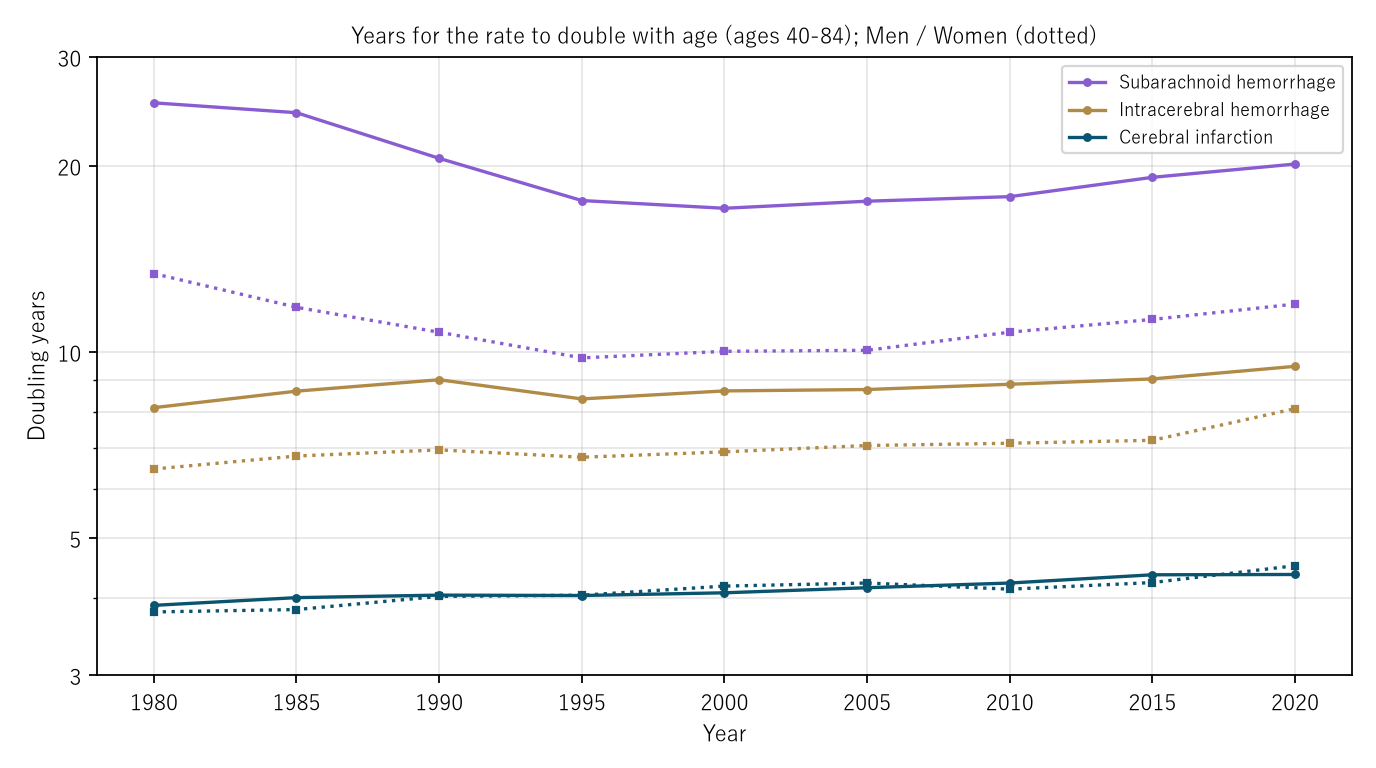
Figure 2: Years for the death rate to double with age (ages 40–84, log scale). Solid lines: men; dotted: women. Purple: subarachnoid hemorrhage; gold: intracerebral hemorrhage; navy: cerebral infarction. The vertical order of the three colors does not change in 40 years.
6. Women and men
Calculation 6.1 Women ÷ men (2020, by age)
| Age | Subarachnoid hemorrhage | Intracerebral hemorrhage | Cerebral infarction |
|---|---|---|---|
| 40–44 | 0.62 | 0.31 | 0.40 |
| 45–49 | 0.73 | 0.37 | 0.50 |
| 50–54 | 0.99 | 0.35 | 0.36 |
| 55–59 | 0.95 | 0.31 | 0.26 |
| 60–64 | 0.94 | 0.31 | 0.25 |
| 65–69 | 1.03 | 0.31 | 0.23 |
| 70–74 | 1.34 | 0.37 | 0.26 |
| 75–79 | 1.43 | 0.48 | 0.34 |
| 80–84 | 1.84 | 0.62 | 0.45 |
| 85–89 | 2.04 | 0.68 | 0.57 |
| 90–94 | 1.82 | 0.70 | 0.79 |
| 95 and over | 2.04 | 0.81 | 1.01 |
Observation 6.2: Women's rates exceed men's only for subarachnoid hemorrhage. For subarachnoid hemorrhage, women exceed men in every group from 65–69 (1.03) up, reaching 2.04 times at 85–89 and at 95 and over. For intracerebral hemorrhage women are lower in every group from age 40 (0.31–0.81), and for cerebral infarction women exceed men only at 95 and over (1.01).
Observation 6.3: In age-standardized death rates too, women exceed men only for subarachnoid hemorrhage, in all nine years (in 2020, women 9.2 and men 7.1). That women's subarachnoid hemorrhage doubles faster (11.9 against 20.1 years) reflects women's rate rising more steeply with age than men's, and points the same way as women exceeding men from ages 65–69.
7. Limitations
- It does not go into why age slopes differ by type.
- These are one year's age-specific rates. They line up people born in different years and are not necessarily how the rate moves as one person ages.
- The fit uses only ages 40–84. Subarachnoid hemorrhage departs somewhat from the constant-speed shape.
- The way death certificates were written changed in 1995 (M035). This paper does not separate the effect of that change on doubling years.
- Prefecture rows are not used, and regions are not compared. It is not one person's likelihood.
Conclusion
The three types of stroke differed clearly in how fast they double with age. For men in 2020, cerebral infarction doubled in 4.4 years, intracerebral hemorrhage in 9.5, and subarachnoid hemorrhage in 20.1, and this order did not change in any of the nine years from 1980 to 2020, for either sex. Over those 40 years, age-standardized death rates from cerebral infarction and intracerebral hemorrhage fell to 0.121–0.216 times, but their age slopes hardly moved. Women's rates exceeded men's only for subarachnoid hemorrhage at ages 65 and over.
One thing separates them — the age slope of each type.
When hearing that "strokes increase with age," check together how differently the three types rise, and whether what has fallen is the level or the slope.
Data and reproduction
| Data | Vital Statistics special report, age-standardized death rates by prefecture (2015 model population), Tables 29–31 (nine editions, 1980–2020), and Vital Statistics 2024 (final data), Volume 1, Table 5.27 (e-Stat, retrieved 26 September 2026) |
| Terms of use | e-Stat follows the Public Data License (Version 2.0). This paper's doubling years and ratios were produced by processing these and are not figures produced by the government |
| Scope | Japan (national), 1980–2020 (every 5 years) |
| Verification | 検算/M037.py (--zu also writes the figures). Every number in the text is taken from 検算/M037_output.txt |
| Raw data | The 28 retrieved files and SOURCES.md (URLs, retrieval dates, SHA-256, terms of use, definitions and calculation) in data/ |
| Figures | 図/M037_zu1, 図/M037_zu2 (png, svg, English versions) |
References
- Ministry of Health, Labour and Welfare. Vital Statistics special report: Age-standardized death rates by prefecture (2015 model population), 1980–2020, Tables 29, 30, and 31 (in Japanese). e-Stat (accessed 26 September 2026). https://www.e-stat.go.jp/
- Ministry of Health, Labour and Welfare. Vital Statistics 2024 (final data), Volume 1, Table 5.27 (in Japanese). e-Stat (accessed 26 September 2026). https://www.e-stat.go.jp/
- Yamagishi, Y. (2026). The Speed at Which Adult Death Rates Double with Age Hardly Moved; What Fell Was the Level [M002]. Zenodo. https://doi.org/10.5281/zenodo.22963210
- Yamagishi, Y. (2026). Life Expectancy Is Not the Number of Years Anyone Actually Lives [M003]. Zenodo. https://doi.org/10.5281/zenodo.22963485
- Yamagishi, Y. (2026). Men's 6.99-Year Doubling Time of the Death Rate Is a Mixture Ranging from Pneumonia at 4.80 Years to Liver Disease at 14.52 [M019]. Zenodo. https://doi.org/10.5281/zenodo.22967853
- Yamagishi, Y. (2026). Heart Disease Deaths Fell by More Than a Tenth in Each of Two Years, 1994 and 1995 — The Years of an Instruction on the Death Certificate; Only Heart Failure Fell (0.377-Fold from 1990 to 1995), While Acute Myocardial Infarction Rose 1.645-Fold [M035]. Zenodo. https://doi.org/10.5281/zenodo.22973433
- Yamagishi, Y. (2026). The Year Cerebral Infarction Deaths Overtook Intracerebral Hemorrhage Depends on Whether One Looks at Counts or at Age-Standardized Rates — For Men, Between 1975 and 1980 by Count and Between 1970 and 1975 by Age-Standardized Rate; the Reversal Came Earlier at Older Ages and Had Not Happened at Ages 59 and Under by 2004 [M036]. Zenodo. https://doi.org/10.5281/zenodo.22973792
Reference
Yamagishi, Y. (2026). The Three Types of Stroke Double with Age at Different Speeds [M037]. Zenodo.
DOI: 10.5281/zenodo.22973884
YOI: https://www.yamagishiyuuki.com/yoi/M037
ORCID: 0009-0006-8587-3450
PDF (English) · PDF (Japanese) · Date proof of the English PDF (OpenTimestamps .ots) · SHA256SUMS
The record page for this paper (in Japanese, with the PDFs in each language and the date proof): YOI M037. This paper is a preprint and has not been peer reviewed.