Abstract
This paper checks at which ages the fall in asthma deaths occurred, using Table 5.15 of the Vital Statistics (causes for time-series comparison × 5-year age groups × year). It compares 1995 (the year ICD-10 was applied) and 2016 (the year before the 2013 version was applied), within the same classification. Ages are combined into five groups: 0–59, 60–69, 70–79, 80–89, and 90+. It claims no new mathematical theorem and no new law.
First, the tables agree with each other: sum of age groups = total, men + women = total, and asthma rates recomputed from the population (all-cause deaths ÷ all-cause death rate) = the rates in the table (Section 3).
Second, this is the core of the paper. From 1995 to 2016, asthma death rates fell to 0.066–0.162 times at every age (the largest fall is at 70–79, 0.066 times; the smallest at 90+, 0.162 times). The ratio of age-aligned rates is 0.093–0.098, between the ratios of the published age-standardized death rates (men 0.073, women 0.126) (Section 4).
Third, deaths fell from 7,253 to 1,455. This change splits into −9,948 from the fall in rates and +4,151 from the change in population; the largest fall is at 80–89 (−1,966) and the smallest at 90+ (−200) (Section 5).
Fourth, the share of deaths at 80+ rose from 0.436 to 0.687. Applying the 1995 rates as they are to the 2016 population already gives 0.614: of the rise of 0.250, 0.708 is accounted for by the population composition (aging) (Section 6).
Fifth, in 2017 deaths jumped from 1,455 to 1,794, 1.233-fold. The ratio from counting the same death records under the new and old classifications is 1.236, and the difference from the 2017 step (divided by the neighbouring growth), 1.323, is 0.087 (Section 7).
Sixth, what separates them is at which ages rates fell, or at which ages people are. That almost everyone who dies of asthma is now old is not so much because rates fell only at younger ages and stayed at older ones, but because rates fell about equally at every age while the population moved to older ages.
Scope note: This paper claims no new mathematical theorem and no new law — age-specific deaths and death rates are in the Vital Statistics; the paper only combines age groups, compares them, and splits the change. This paper is a structural interpretation of the shape of numbers in published aggregate data, and is not medical advice, diagnosis, or a treatment recommendation. The author is not a physician. For decisions about individual health, consult a physician or medical institution. It is a preprint that has not been peer reviewed. It does not go into why asthma death rates fell (treatment, medicines, diagnosis, environment, and so on). It does not cover the number of people with asthma — only deaths. Sexes are not separated, and ages are combined so as not to create cells with fewer than 10 deaths. Years before 1995 use a different classification and are left out of the comparison (they are shown in the table and figure). Prefectures and regions are not compared. About the data: the Vital Statistics on e-Stat are used under the Public Data License (Version 2.0), and the Ministry of Health, Labour and Welfare's documents under the Public Data License (Version 1.0); this paper's rates, ratios, and splits were produced by processing them. What the paper adds: showing that, within the same classification from 1995 to 2016, asthma death rates fell about equally at every age, and splitting the rise in the age of those who die into population composition and differences in rates, and setting the 2017 step beside the new/old ratio.
1. Notation and question
- Age groups: 0–59, 60–69, 70–79, 80–89, 90+.
- Population: all-cause deaths ÷ all-cause death rate × 100,000 (by 5-year group). For 90+ in 2000 and earlier, the sum of deaths at 90+ ÷ the rate in the 90–94 column (table note: that year's rate for 90–94 is the rate for 90+).
- Part from the fall in rates, part from the change in population: for each age, (difference in rates) × (average population) and (difference in population) × (average rate). The two add up to the change in deaths.
Question: at which ages did the fall in asthma deaths occur? Why did the age of those who die rise?
Observation 1.1: M024 and M038 split rises in deaths into the push from the age composition and the movement of age-standardized rates. This paper applies that to the age content of a cause of death that is shrinking (asthma). M041 showed that the 2017 classification change predicts the step by cause. Asthma was not among the causes compared there (3,000 or more deaths in 2016), so it is examined in Section 7 of this paper.
2. Survey and design
Stated honestly: the design was set after seeing the tables.
| Content | |
|---|---|
| Deaths and death rates | Vital Statistics 2024, Volume 1, Table 5.15 (sheets "total" and "09 asthma", 1950–2024) |
| Checks | Table 5.14 (age-standardized death rates, 2015 model population), Table 3 of the document on the effects of the partial revision of ICD-10 (asthma), and the note in the 2017 overview (application of ICD-10 in 1995) |
| Yardsticks | Ratios of age-specific death rates, ratio of age-aligned rates, split of the change in deaths, split of the share at 80+ |
| Grouping | 0–39 alone would have 9 deaths in 2024, fewer than 10 → combined into 0–59 |
| Noticed along the way | The fact that the 90–94 rate in 2000 and earlier is the rate for 90+ was first overlooked, and the 1995 rate at 90+ was first computed as 201.33. It failed the check of rates recomputed from the population against the table, which revealed the error, and it was corrected (the right value is 153.37) |
3. Data and checks
Calculation 3.1 The 4 retrieved files were fixed by SHA-256, and the following was checked.
- Asthma deaths: sum of age groups (22 groups including unknown) = total (3 sexes × 24 rounds); men + women = total.
- In 2000 and earlier, the death rate at 95–99 is "…" (as in the table note, the 90–94 column is the rate for 90+). Asthma rates recomputed from the population = asthma rates in the table (61 cells, within rounding).
- The asthma deaths in the cells shown in this paper (6 years and 2017 × 5 ages) are 10 or more.
- The note in the 2017 overview states that ICD-10 (2003 version) was applied from January 1995. In Table 3 of the effects document, asthma is new 278 and old 225 (ratio 123.6).
4. Core — rates fell about equally at every age
Calculation 4.1 Asthma death rates by age (per 100,000, both sexes)
| Age | 1950 | 1970 | 1990 | 1995 | 2016 | 2024 |
|---|---|---|---|---|---|---|
| 0–59 | 5.49 | 2.08 | 1.08 | 1.11 | 0.14 | 0.11 |
| 60–69 | 123.33 | 29.50 | 7.80 | 7.41 | 0.63 | 0.51 |
| 70–79 | 285.98 | 93.29 | 25.38 | 24.78 | 1.64 | 1.09 |
| 80–89 | 372.00 | 212.35 | 68.68 | 72.55 | 6.18 | 3.72 |
| 90+ | 293.49 | 299.53 | 126.85 | 153.37 | 24.87 | 13.66 |
Calculation 4.2 1995 → 2016 (same classification)
| Age | Death rate 1995 → 2016 | Ratio | Deaths 1995 → 2016 | Part from rates | Part from population |
|---|---|---|---|---|---|
| 0–59 | 1.11 → 0.14 | 0.124 | 1,093 → 113 | -879 | -101 |
| 60–69 | 7.41 → 0.63 | 0.085 | 1,024 → 115 | -1,090 | +181 |
| 70–79 | 24.78 → 1.64 | 0.066 | 1,970 → 228 | -2,524 | +782 |
| 80–89 | 72.55 → 6.18 | 0.085 | 2,487 → 521 | -3,936 | +1,970 |
| 90+ | 153.37 → 24.87 | 0.162 | 678 → 478 | -1,519 | +1,319 |
Observation 4.3: At all five ages, rates became smaller than 0.2 times (0.066–0.162 times). The largest fall is at 70–79 (0.066 times) and the smallest at 90+ (0.162 times); 0–59, 60–69, and 80–89 are 0.085–0.124 times. The fall did not happen at just one age.
Observation 4.4: The ratio of age-aligned rates is 0.093 (weighted by the 1995 population) to 0.098 (weighted by the 2016 population). The published age-standardized death rates (2015 model population) go from 17.7 to 1.3 for men (0.073 times) and from 8.7 to 1.1 for women (0.126 times); this paper's ratios lie between them. The ratio of crude death rates is 0.200, and the push from the age composition is 2.027–2.146.
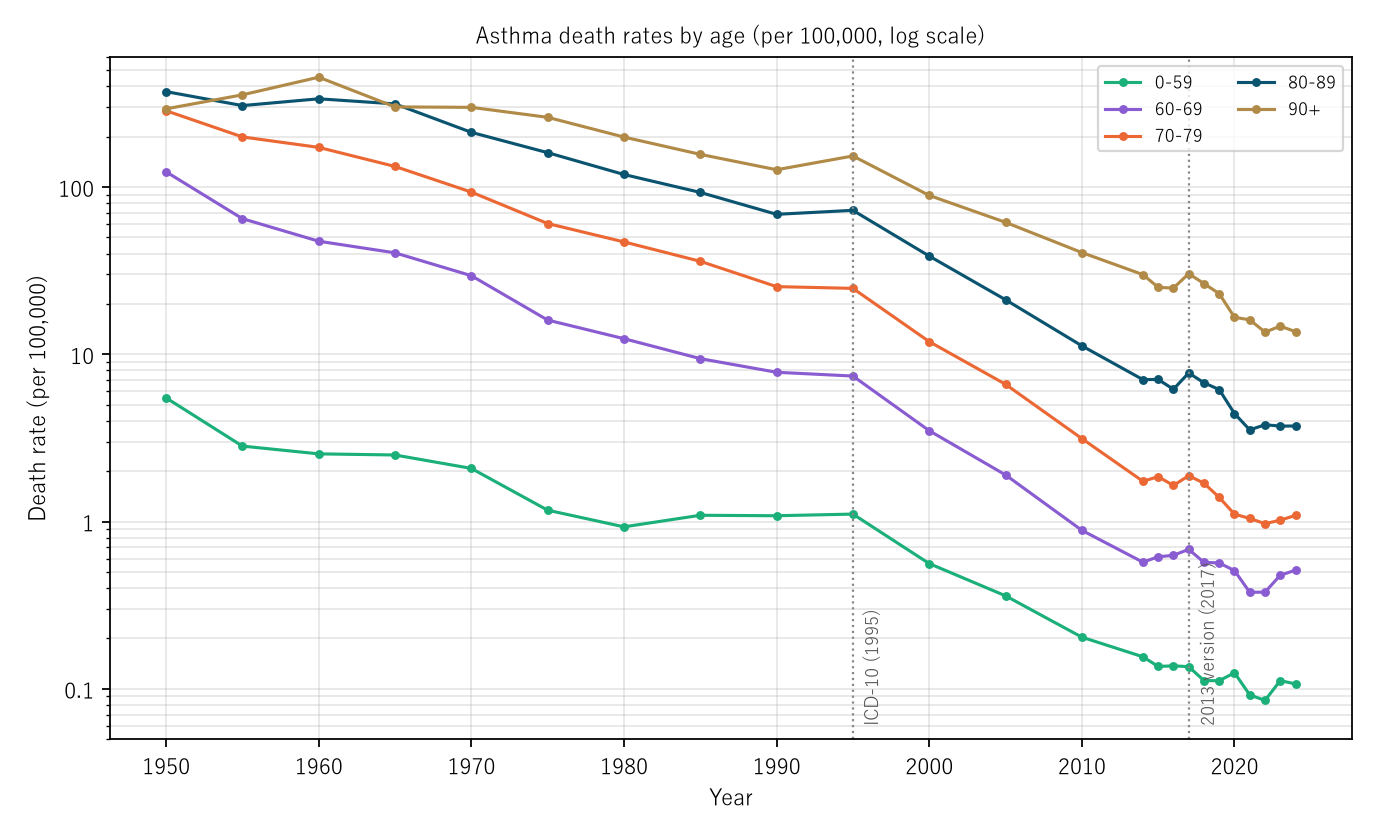
Figure 1: Asthma death rates by age (vertical log scale). Dotted lines mark the classification changes (application of ICD-10 in 1995 and of the 2013 version in 2017). From 1995 to 2016, the five lines fall together.
5. Splitting the fall in deaths into rates and population
Observation 5.1: Deaths went from 7,252 in 1995 (excluding unknown age) to 1,455 in 2016, −5,797. The part from the fall in rates is −9,948 and the part from the change in population is +4,151: the population moving to older ages offset part of the fall. By age, the fall at 80–89 (−1,966) is the largest, and 70–89 account for 0.640 of the fall. The fall at 90+ is the smallest, −200: the change in population (+1,319) nearly offset the part from rates (−1,519) (the population at 90+ grew from 44 to 192, in units of ten thousand people).
6. Did the age of those who die rise because of differences in rates, or because of the population composition?
Observation 6.1: The share of deaths at 80+ rose from 0.436 in 1995 to 0.687 in 2016. Applying the 1995 rates as they are to the 2016 population (equivalent to rates falling by the same factor at every age) gives a share at 80+ of 0.614. Of the rise of +0.250, the part from the population composition is +0.177 (0.708), and the part from rates falling differently by age is +0.073.
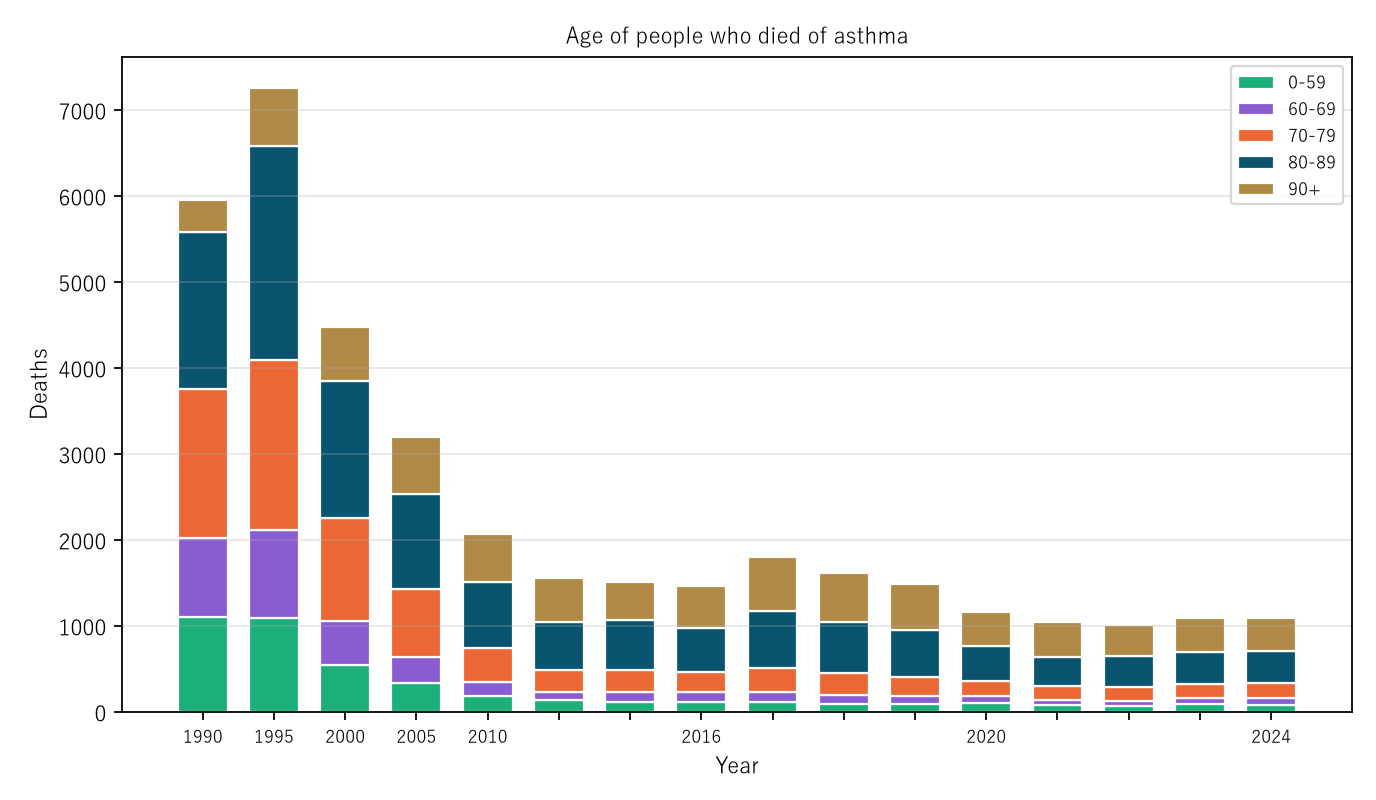
Figure 2: Asthma deaths stacked by age group (every 5 years for 1990–2010, every year from 2014).
7. The 2017 step
Observation 7.1: In 2017 deaths jumped from 1,455 to 1,794, 1.233-fold. The ratio from counting the same death records under the new and old classifications is 1.236 (old 225, new 278). The 2017 step divided by the neighbouring growth (0.932) is 1.323, a difference of 0.087 from the new/old ratio. From 2017 to 2024 (the same 2013-version classification), deaths went from 1,794 to 1,088, 0.606 times.
8. Limitations
- Only deaths are examined; the number or severity of people with asthma is not covered.
- Sexes are not separated. The ratios of the published age-standardized death rates differ: men 0.073, women 0.126.
- Ages are combined into five groups, so skews within a group (for example, within 0–59) are not separated.
- The classification of causes of death changed in 1995 and 2017. The comparison is within the same classification, 1995–2016.
- It does not go into why rates fell. It is not one person's likelihood.
Conclusion
From 1995 to 2016, asthma death rates fell to 0.066–0.162 times at every age. Deaths fell from 7,253 to 1,455, and the share of deaths at 80+ rose from 0.436 to 0.687, but 0.708 of that rise is accounted for by population aging.
One thing separates them — at which ages rates fell, or at which ages people are.
When hearing that "almost everyone who dies of this disease is now old," check together how age-specific rates moved and at which ages the population is.
Data and reproduction
| Data | Vital Statistics 2024 (final data), Volume 1, Tables 5.15 and 5.14 (e-Stat, retrieved 26 September 2026); the Ministry of Health, Labour and Welfare's "Effects of the partial revision of ICD-10 on cause-of-death statistics" and the 2017 overview of monthly vital statistics annual estimates (retrieved the same day) |
| Terms of use | e-Stat follows the Public Data License (Version 2.0), and the Ministry's pages the Public Data License (Version 1.0). This paper's rates, ratios, and splits were produced by processing these and are not figures produced by the government |
| Scope | Japan; both sexes; 1950–2024 (compared: 1995 and 2016) |
| Verification | 検算/M042.py (--zu also writes the figures). Every number in the text is taken from 検算/M042_output.txt |
| Raw data | The 4 retrieved files and SOURCES.md (URLs, retrieval dates, SHA-256, terms of use, definitions and calculation) in data/ |
| Figures | 図/M042_zu1, 図/M042_zu2 (png, svg, English versions) |
References
- Ministry of Health, Labour and Welfare. Effects of the partial revision of ICD-10 on cause-of-death statistics (in Japanese) (accessed 26 September 2026). https://www.mhlw.go.jp/toukei/list/dl/icd_2013_eikyo.pdf
- Ministry of Health, Labour and Welfare. Overview of the 2017 monthly vital statistics annual estimates: Summary of results (in Japanese) (accessed 26 September 2026). https://www.mhlw.go.jp/toukei/saikin/hw/jinkou/geppo/nengai17/dl/kekka.pdf
- Ministry of Health, Labour and Welfare. Vital Statistics 2024 (final data), Volume 1, Tables 5.14 and 5.15 (in Japanese). e-Stat (accessed 26 September 2026). https://www.e-stat.go.jp/
- Yamagishi, Y. (2026). Cancer Deaths Rose While the Age-Adjusted Rate Fell — the Push from the Age Composition Ranges from 1.433 Times for Breast to 2.918 Times for Prostate [M024]. Zenodo. https://doi.org/10.5281/zenodo.22968432
- Yamagishi, Y. (2026). Heart Failure Deaths Rose Because of the Age Composition, While Its Share of Heart Disease Rose Because Acute Myocardial Infarction Fell Faster — For Men from 1995 to 2020, Heart Failure's Crude Death Rate Rose 2.070-Fold and Its Age-Standardized Rate Fell to 0.844, While Acute Myocardial Infarction's Age-Standardized Rate Fell to 0.279 [M038]. Zenodo. https://doi.org/10.5281/zenodo.22974029
- Yamagishi, Y. (2026). The Fall in Pneumonia Deaths in 2017 Is Nearly Predicted by the Ratio from Recoding the Same Death Records under the New and Old Classifications — for Pneumonia, an Actual Step of 0.826 Against a New/Old Ratio of 0.810, a Correlation of 0.969 Across 65 Causes, and the Lost Deaths Moved to Dementia, Alzheimer's Disease, Heart Failure, COPD, and Others [M041]. Zenodo. https://doi.org/10.5281/zenodo.22974374
Reference
Yamagishi, Y. (2026). Asthma Death Rates Fell to 0.066–0.162 Times at Every Age from 1995 to 2016 [M042]. Zenodo.
DOI: 10.5281/zenodo.22974412
YOI: https://www.yamagishiyuuki.com/yoi/M042
ORCID: 0009-0006-8587-3450
PDF (English) · PDF (Japanese) · Date proof of the English PDF (OpenTimestamps .ots) · SHA256SUMS
The record page for this paper (in Japanese, with the PDFs in each language and the date proof): YOI M042. This paper is a preprint and has not been peer reviewed.