Abstract
This paper checks whether asthma among children counted in the School Health Statistics Survey (prevalence of asthma) and the asthma death rate of children (ages 5–19) in the Vital Statistics moved in the same shape. The school table covers fiscal years 1948–2025 (asthma from 1967), and deaths cover 1950–2024. Years in which deaths fall below 10 are pooled into a rate per year. It claims no new mathematical theorem and no new law.
First, the tables are consistent. The school table has 12 sheets (4 school levels × total, boys, girls), the year rows are the 78 fiscal years 1948–2025, and the total lies between boys and girls in every year. Children's asthma rates recomputed from the population match the rates in the table (Section 3).
Second, asthma counted at school kept rising for a long time. At all four school levels, prevalence is highest in 2010–2013, 9.6 times (kindergarten) to 69.3 times (high school) its 1967 level (Section 4).
Third, prevalence then began to fall. In fiscal 2025 it is below the highest year at all four levels, at 0.466 (kindergarten) to 0.742 (elementary school) of it (Section 4).
Fourth, asthma deaths of children fell sharply over the same span. The asthma death rate at ages 5–19 (per 100,000) is 0.540 in 1990, 0.468 in 1995, 0.175 in 2000, 0.042 in 2005 and 2010, and 0.010 in 2014–2024; deaths went from 105 in 1995 to 18 in total over the 11 years 2014–2024 (Section 5).
Fifth, this is the core of the paper. From 1990 to 2014–2024, prevalence rose 2.35–3.91-fold and the death rate fell to 0.019 times. From 1970 to 1990 as well, prevalence rose 1.40–9.60-fold and the death rate fell to 0.542 times. The number of children with asthma and the number who die of it moved in opposite directions (Section 6).
Sixth, what separates them is the number of children who have it, or the number who die of it. "More children have asthma" and "fewer children die of asthma" are both as the tables say, and neither cancels the other.
Scope note: This paper claims no new mathematical theorem and no new law — prevalence and deaths are in the published tables; the paper only sets them side by side. This paper is a structural interpretation of the shape of numbers in published aggregate data, and is not medical advice, diagnosis, or a treatment recommendation. The author is not a physician. For decisions about individual health, consult a physician or medical institution. It is a preprint that has not been peer reviewed. It does not argue why prevalence rose or why the death rate fell — it does not go into how diagnoses are made, how cases are counted, treatment, or environment. The age ranges of school prevalence and deaths differ (school: kindergarten to high school; deaths: ages 5–19). It is not one person's likelihood. Child deaths are small numbers, so years with fewer than 10 were pooled. Prefectures, regions, and schools are not compared. About the data: the School Health Statistics Survey and the Vital Statistics on e-Stat are used under the Public Data License (Version 2.0); this paper's rates and ratios were produced by processing them. What the paper adds: setting asthma counted at school and children's asthma deaths side by side in the same years, and showing their opposite movements as ratios.
1. Notation and question
- Prevalence: "asthma" in the School Health Statistics Survey (%, the share among children at that school level).
- Children's asthma death rate: asthma deaths at ages 5–19 ÷ population at ages 5–19 × 100,000 (population recovered from all-cause deaths ÷ death rate).
- Pooled years: 2005 and 2010 (two years) and 2014–2024 (11 years). The prevalence set beside pooled years is the average over the same fiscal years.
Question: did asthma among children counted at school and children's asthma deaths move in the same shape?
Observation 1.1: M042 showed that asthma death rates fell at every age from 1995 to 2016. This paper takes the children's ages from that and sets them beside the number of children who have asthma (school prevalence).
2. Survey and design
Stated honestly: the design was set after seeing the tables.
| Content | |
|---|---|
| Children who have it | "Asthma" in the School Health Statistics Survey, annual statistics Table 15: prevalence of diseases and abnormalities by school level (fiscal 1948 to fiscal 2025) |
| Children who die of it | Vital Statistics 2024, Volume 1, Table 5.15 (sheets "total" and "09 asthma", ages 5–19) |
| Yardsticks | Ratios of prevalence, ratios of death rates |
| Pooling | Asthma deaths at ages 5–19 are below 10 per year from 2005 (9, 6, 3, 3, 2, 1, 1, 1, 3, 1, 2, 1, 0) → years pooled |
| Correction to the source record | The source record first said that asthma for junior high and high schools starts in 1972, but reading the table showed that all four levels start in 1967 (corrected) |
3. Data and checks
Calculation 3.1 The 2 retrieved files were fixed by SHA-256, and the following was checked.
- School table: the 12 sheet headings are kindergarten, elementary, junior high, and high school × total, boys, girls. Each sheet has exactly one "asthma" column. The year rows are the 78 fiscal years 1948–2025 (no gaps or overlaps when converting Japanese era years). The total lies between boys and girls (all years, all four levels).
- Death table: for the three age groups 5–19, asthma rates recomputed from the population (all-cause deaths ÷ death rate) = the rates in the table (within rounding).
- Every group used for a rate (single years and pooled years) has 10 or more deaths.
4. Asthma counted at school
Calculation 4.1 Prevalence of asthma (%)
| School level | FY1970 | FY1990 | FY1995 | Average FY2014–2024 | Highest year | FY2025 |
|---|---|---|---|---|---|---|
| Kindergarten | 0.50 | 0.70 | 0.91 | 1.64 | 2.79 (2011) | 1.30 |
| Elementary school | 0.40 | 1.05 | 1.38 | 3.40 | 4.34 (2011) | 3.22 |
| Junior high school | 0.10 | 0.96 | 1.44 | 2.54 | 3.22 (2013) | 2.14 |
| High school | 0.10 | 0.45 | 0.78 | 1.76 | 2.08 (2010) | 1.53 |
Observation 4.2: At all four levels, prevalence is highest in fiscal 2010–2013, 9.6–69.3 times its 1967 level. Fiscal 2025 is 0.466 (kindergarten) to 0.742 (elementary school) of the highest year.
5. Children's asthma deaths
Calculation 5.1 Asthma deaths at ages 5–19 and the death rate per year (per 100,000)
| Year | Deaths | Number of years | Death rate per year |
|---|---|---|---|
| 1970 | 248 | 1 | 0.996 |
| 1980 | 98 | 1 | 0.362 |
| 1990 | 140 | 1 | 0.540 |
| 1995 | 105 | 1 | 0.468 |
| 2000 | 35 | 1 | 0.175 |
| 2005, 2010 | 15 | 2 | 0.042 |
| 2014–2024 | 18 | 11 | 0.010 |
Observation 5.2: The asthma death rate at ages 5–19 fell from 0.996 in 1970 to 0.010 in 2014–2024. Deaths were 105 in 1995 and 35 in 2000, and from 2005 they do not reach 10 in a year.
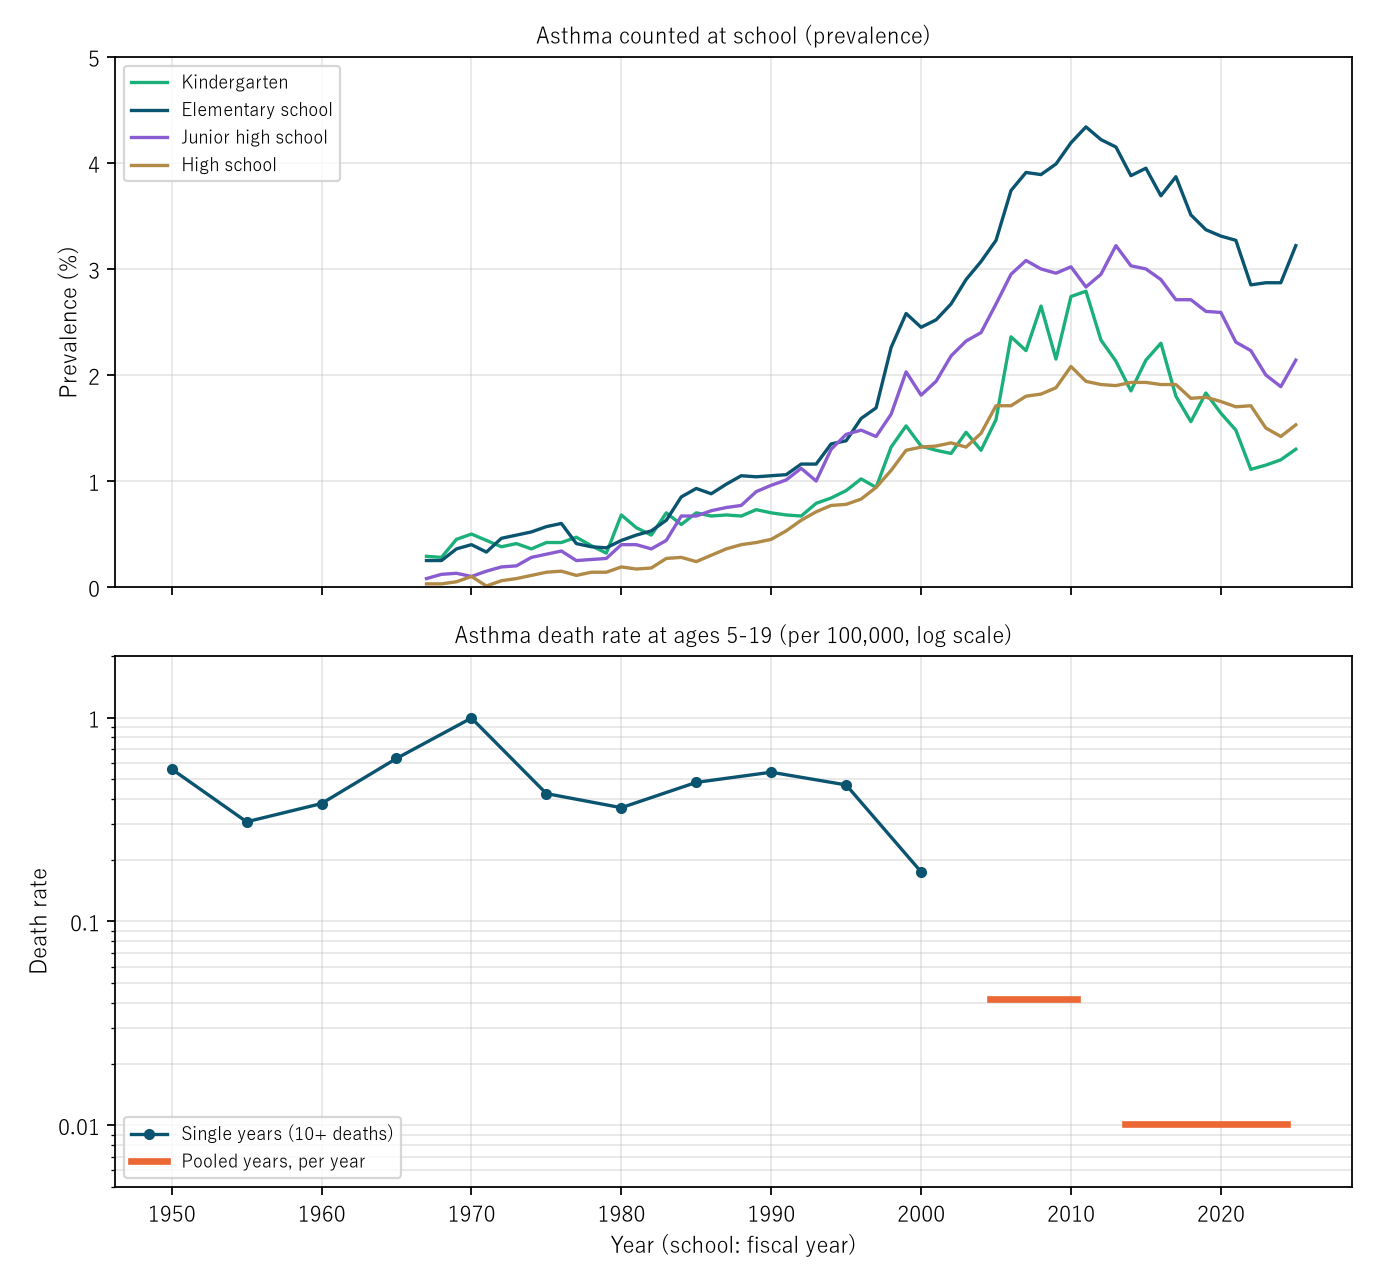
Figure 1: Top: prevalence of asthma counted at school (%). Bottom: asthma death rate at ages 5–19 (per 100,000, log scale). The horizontal bars at the bottom are pooled rates per year (two years for 2005 and 2010; 11 years for 2014–2024). While the top rises, the bottom falls.
6. Core — prevalence and the death rate over the same spans
Calculation 6.1 Ratios of prevalence and of the death rate (prevalence for the same years as the death rate; pooled years use the average over the same fiscal years)
| Span | Ratio of death rate | Kindergarten | Elementary | Junior high | High school |
|---|---|---|---|---|---|
| 1970 → 1990 | 0.542× | 1.40× | 2.62× | 9.60× | 4.50× |
| 1990 → 2014–2024 | 0.019× | 2.35× | 3.24× | 2.65× | 3.91× |
| 1995 → 2014–2024 | 0.022× | 1.80× | 2.47× | 1.77× | 2.25× |
Observation 6.2: From 1990 to 2014–2024, the death rate fell to 0.019 times while prevalence rose 2.35–3.91-fold at all four levels. From 1970 to 1990 as well, the death rate was 0.542 times and prevalence 1.40–9.60-fold: the same opposite movement. Comparing from 1995, the death rate is 0.022 times and prevalence 1.77–2.47-fold.
7. Limitations
- The age ranges of school prevalence and deaths differ (school: kindergarten to high school; deaths: ages 5–19).
- School data are by fiscal year and deaths by calendar year; years with the same number were set side by side.
- Children's asthma deaths are small numbers, and years were pooled from 2005. Pooled rates smooth the year-to-year variation.
- It does not argue why prevalence rose or why the death rate fell. Possible changes in how cases are counted or diagnosed are not separated.
- It is not one person's likelihood.
Conclusion
Asthma among children counted at school kept rising from fiscal 1967 to fiscal 2010–2013, and rose 2.35–3.91-fold from 1990 to 2014–2024. Over the same span, the asthma death rate at ages 5–19 fell to 0.019 times, and deaths went from 105 in 1995 to 18 in total over the 11 years 2014–2024.
One thing separates them — the number of children who have it, or the number who die of it.
When hearing that "the disease is increasing" or "the disease is decreasing," check together whether it is about the number of people who have it or the number who die of it.
Data and reproduction
| Data | School Health Statistics Survey, annual statistics Table 15: prevalence of diseases and abnormalities by school level (fiscal 1948 to fiscal 2025); Vital Statistics 2024 (final data), Volume 1, Table 5.15 (e-Stat, retrieved 26 September 2026) |
| Terms of use | e-Stat follows the Public Data License (Version 2.0). This paper's rates and ratios were produced by processing these and are not figures produced by the government |
| Scope | Japan; schools (kindergarten, elementary, junior high, high) and ages 5–19; 1950–2025 |
| Verification | 検算/M043.py (--zu also writes the figure). Every number in the text is taken from 検算/M043_output.txt |
| Raw data | The 2 retrieved files and SOURCES.md (URLs, retrieval dates, SHA-256, terms of use, definitions and calculation) in data/ |
| Figures | 図/M043_zu1 (png, svg, English version) |
References
- Ministry of Education, Culture, Sports, Science and Technology. School Health Statistics Survey, annual statistics Table 15: Prevalence of diseases and abnormalities by school level (fiscal 1948 to fiscal 2025) (in Japanese). e-Stat (accessed 26 September 2026). https://www.e-stat.go.jp/
- Ministry of Health, Labour and Welfare. Vital Statistics 2024 (final data), Volume 1, Table 5.15 (in Japanese). e-Stat (accessed 26 September 2026). https://www.e-stat.go.jp/
- Yamagishi, Y. (2026). Asthma Death Rates Fell to 0.066–0.162 Times at Every Age from 1995 to 2016 — Of the Rise in the Share of Deaths at 80+ from 0.436 to 0.687, 0.708 Is Due to Population Aging [M042]. Zenodo. https://doi.org/10.5281/zenodo.22974412
Reference
Yamagishi, Y. (2026). Asthma Counted at School Rose 2.35–3.91-Fold from 1990 to 2014–2024, While the Asthma Death Rate at Ages 5–19 Fell to 0.019 Times over the Same Span [M043]. Zenodo.
DOI: 10.5281/zenodo.22974442
YOI: https://www.yamagishiyuuki.com/yoi/M043
ORCID: 0009-0006-8587-3450
PDF (English) · PDF (Japanese) · Date proof of the English PDF (OpenTimestamps .ots) · SHA256SUMS
The record page for this paper (in Japanese, with the PDFs in each language and the date proof): YOI M043. This paper is a preprint and has not been peer reviewed.