Abstract
This paper checks whether the age × year shape of death rates from COPD (chronic obstructive pulmonary disease) differs between men and women, using the national rows of Table 33 of the Vital Statistics special report on age-standardized death rates by prefecture (2015 model population). The table has 9 editions from 1980 to 2020; the comparison uses the 5 editions 1995–2015, which share the same classification, and 8 age groups from 55–59 to 90–94. It claims no new mathematical theorem and no new law.
First, the tables and the method were checked. All 9 table headings are Table 33, chronic obstructive pulmonary disease, and the comparison of two fits picks the right side on synthetic rates (Section 3).
Second, from 1995 to 2015, the age-standardized death rate became 0.603 times for men and 0.351 times for women: women's fell more. The men-to-women ratio widened from 4.33 to 7.44 (Section 4).
Third, by age, women's rates fell together to 0.28–0.40 times at every age from 65, while men's fell less at older ages, from 0.42 times at 75–79 to 0.83 times at 90–94 (width of the ratios at 65 and over: women 0.12, men 0.41) (Section 5).
Fourth, this is the core of the paper. Fitting ln(death rate) by "age + birth year" rather than "age + year" cuts the remainder per degree of freedom to 1/3.24 for men and 1/1.25 for women. Men's rates line up by birth year; women's hardly do (Section 6).
Fifth, the classification changes were kept out of the comparison. From 1990 to 1995 (application of ICD-10), age-standardized rates jumped 1.266-fold for men and 1.144-fold for women, and with the 2017 classification change, COPD is counted 1.206 times on the same death records (Section 7).
Sixth, what separates them is whether rates line up by year or by birth year. Behind the same "COPD death rates fell," women's rates fell together at every age, while for men the differences between birth years remain in the shape of the age-specific rates.
Scope note: This paper claims no new mathematical theorem and no new law — age-specific death rates are in the published tables; the paper only compares them with two fits. This paper is a structural interpretation of the shape of numbers in published aggregate data, and is not medical advice, diagnosis, or a treatment recommendation. The author is not a physician. For decisions about individual health, consult a physician or medical institution. It is a preprint that has not been peer reviewed. It does not go into why the shape differs between men and women (tobacco, work, diagnosis, treatment, and so on), and does not link it to any cause. Of year, birth year, and age, the linear slopes cannot be separated (because year = birth year + age). What the paper can compare is the curved shape after removing the slopes. It is not one person's likelihood. Prefecture rows are not used and regions are not compared. About the data: the Vital Statistics special report on e-Stat is used under the Public Data License (Version 2.0), and the Ministry of Health, Labour and Welfare's documents under the Public Data License (Version 1.0); this paper's ratios and fits were produced by processing them. What the paper adds: showing with one method, within 1995–2015 under the same classification, that COPD death rates line up by birth year for men and by year more readily for women, and checking the method itself on synthetic rates.
1. Notation and question
- Two fits: fit ln(death rate) by "age + year" or by "age + birth year". Birth year is "year − middle age of the group" (5-year steps).
- Value compared: sum of squared remainders ÷ degrees of freedom (number of cells − number of fitted values). The birth-year fit uses more fitted values (19 vs 12), so it is divided by the degrees of freedom.
- Editions compared: 1995, 2000, 2005, 2010, 2015 (same classification). Ages: 8 groups from 55–59 to 90–94 (40 cells).
Question: does the age × year shape of COPD death rates differ between men and women? Do rates line up by year or by birth year?
Observation 1.1: M033 showed, using peak years, that the peaks of men's liver cancer death rates line up by birth year while those of lung and colorectal cancer line up by year. This paper measures the same question for COPD using the remainders of two fits. M003 showed that life expectancy changes depending on whether a life table is read across one year or down one birth cohort. M041 gave the ratio of the 2017 classification change.
2. Survey and design
Stated honestly: the design was set after seeing the tables.
| Content | |
|---|---|
| Death rates | Vital Statistics special report, age-standardized death rates by prefecture (2015 model population), Table 33 (chronic obstructive pulmonary disease, 9 editions 1980–2020, national rows, by sex) |
| Classification changes | Note in the 2017 overview (application of ICD-10 in 1995); Table 3 of the document on the effects of the partial revision of ICD-10 (COPD new/old ratio) |
| Yardsticks | Ratios of age-standardized rates, ratios of age-specific rates, remainder per degree of freedom of two fits |
| Data not used | "Chronic bronchitis and emphysema" in Table 5.15 of the Vital Statistics (age × year) is only part of COPD and not the same scope, so it was not used |
| Noticed along the way | In the method's self-test, a year effect built as a linear decline could be represented just as well by the birth-year fit (year = birth year + age). Since linear slopes cannot be separated, the self-test was rebuilt with a curved effect, and this limit is stated in the scope note |
3. Data and checks
Calculation 3.1 The 11 retrieved files were fixed by SHA-256, and the following was checked.
- The table-number fields of the 9 files are S55-33, S60-33, H02-33, H07-33, H12-33, H17-33, H22-33, H27-33, and R02-33, and the headings are chronic obstructive pulmonary disease. The rates for the 8 age groups used are above 0 in all 9 editions for both sexes.
- The method's self-test: on rates built from a birth-year effect only, the birth-year fit (0.00029 vs 0.01340) is smaller in remainder per degree of freedom, and on rates built from a curved year effect, the year fit (0.00035 vs 0.04126) is. On synthetic rates with only a linear decline, both are 0.00039 and cannot be told apart.
- The note in the 2017 overview states that ICD-10 (2003 version) was applied from January 1995, and Table 3 of the effects document gives COPD as new 2,641 and old 2,190 (ratio 120.6).
4. Age-standardized death rates and the men-to-women ratio
Calculation 4.1 COPD age-standardized death rates (per 100,000, 2015 model population)
| Year | Men | Women | Men ÷ women |
|---|---|---|---|
| 1980 | 31.5 | 9.6 | 3.28 |
| 1985 | 37.7 | 10.6 | 3.56 |
| 1990 | 38 | 9.7 | 3.92 |
| 1995 | 48.1 | 11.1 | 4.33 |
| 2000 | 39.9 | 7.7 | 5.18 |
| 2005 | 36.8 | 6.2 | 5.94 |
| 2010 | 35.4 | 5.3 | 6.68 |
| 2015 | 29 | 3.9 | 7.44 |
| 2020 | 25.7 | 2.9 | 8.86 |
Observation 4.2: From 1995 to 2015, the age-standardized death rate became 0.603 times for men and 0.351 times for women: women's fell more. The men-to-women ratio widened from 4.33 to 7.44 (across classification changes, from 3.28 in 1980 to 8.86 in 2020, the ratio kept widening).
5. How age-specific rates fell
Calculation 5.1 Age-specific death rates (per 100,000), 1995 → 2015
| Age | Men 1995 → 2015 | Ratio, men | Women 1995 → 2015 | Ratio, women |
|---|---|---|---|---|
| 55–59 | 2.2 → 1.4 | 0.64× | 0.7 → 0.4 | 0.57× |
| 60–64 | 8.2 → 5.4 | 0.66× | 1.8 → 0.9 | 0.50× |
| 65–69 | 24.6 → 12 | 0.49× | 4.4 → 1.5 | 0.34× |
| 70–74 | 66.9 → 31.5 | 0.47× | 11.5 → 4.6 | 0.40× |
| 75–79 | 164.9 → 69 | 0.42× | 31.9 → 8.9 | 0.28× |
| 80–84 | 307.2 → 155.8 | 0.51× | 61.1 → 19.7 | 0.32× |
| 85–89 | 457 → 324.5 | 0.71× | 111.5 → 38.3 | 0.34× |
| 90–94 | 589.9 → 489.7 | 0.83× | 183.5 → 65 | 0.35× |
Observation 5.2: Women's rates fell together to 0.28–0.40 times at every age from 65 (width 0.12). Men's fell less at older ages, from 0.42 times at 75–79 to 0.83 times at 90–94 (width 0.41). Men's ratio at 90–94 is more than 1.5 times that at 75–79.
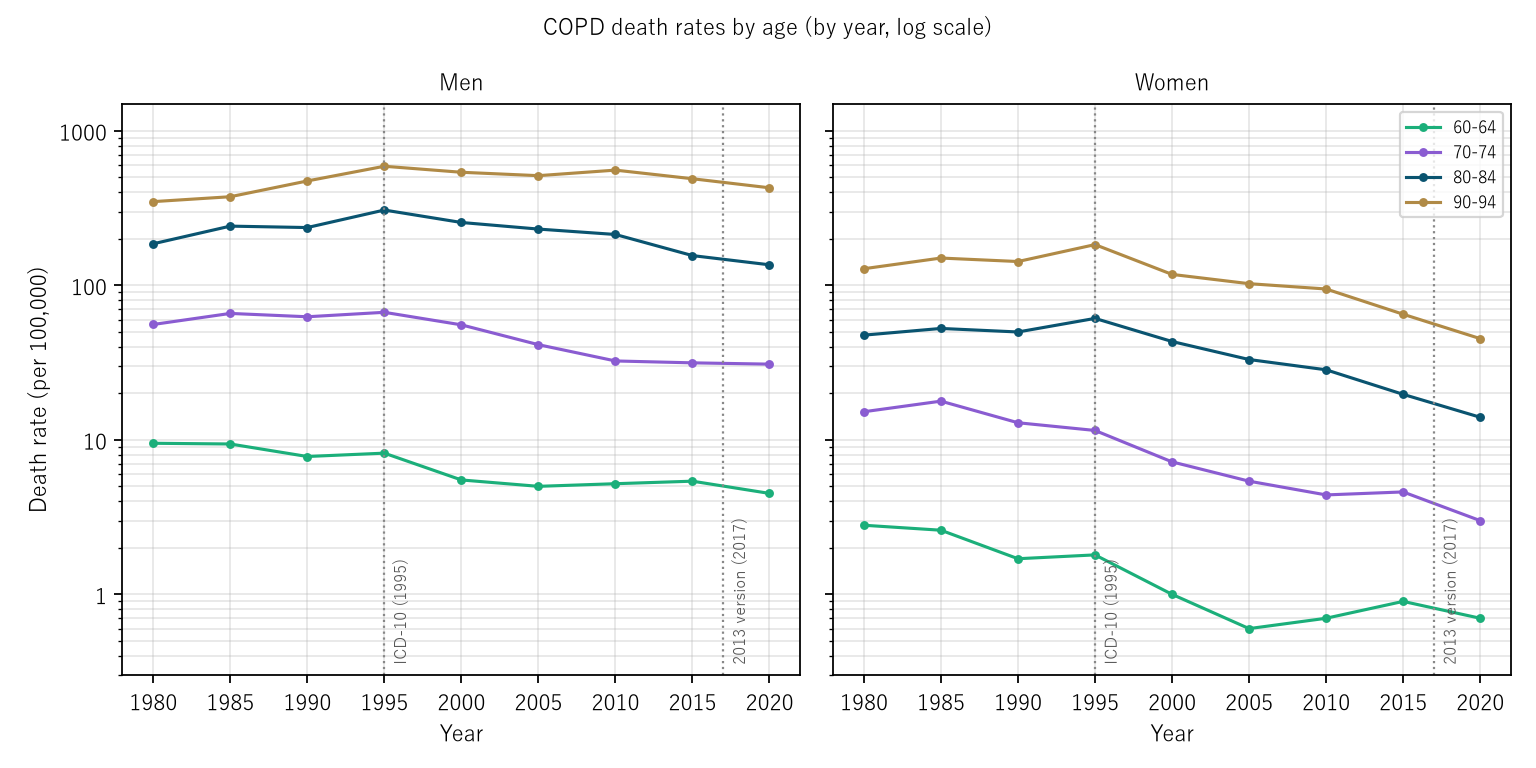
Figure 1: COPD death rates by age (vertical log scale; left men, right women). Dotted lines mark the classification changes (ICD-10 in 1995, 2013 version in 2017). Women's lines fall together from 1995; men's lines at older ages fall little.
6. Core — lining up by year or by birth year
Calculation 6.1 Two fits (1995–2015, 8 ages × 5 editions = 40 cells)
| Sex | Age + year: remainder per d.f. | Age + birth year: remainder per d.f. | Year ÷ birth year |
|---|---|---|---|
| Men | 0.0205 | 0.0063 | 3.24 |
| Women | 0.0237 | 0.0190 | 1.25 |
Observation 6.2: For men, aligning by birth year cuts the remainder per degree of freedom to 1/3.24. For women it is 1/1.25, a small difference. Men's age-specific rates line up by birth year; women's hardly do.
Observation 6.3: In the men's fit, the birth-year effect (ratio to the oldest, around 1902, set to 1) barely moves at 1.00–0.90 for around 1902–1918, falls from 0.80 to 0.35 for around 1922–1942, and is 0.37 and 0.39 for around 1948 and 1952. Since the slope cannot be separated from year, what can be read is this curved shape (flat → steep fall → flat).
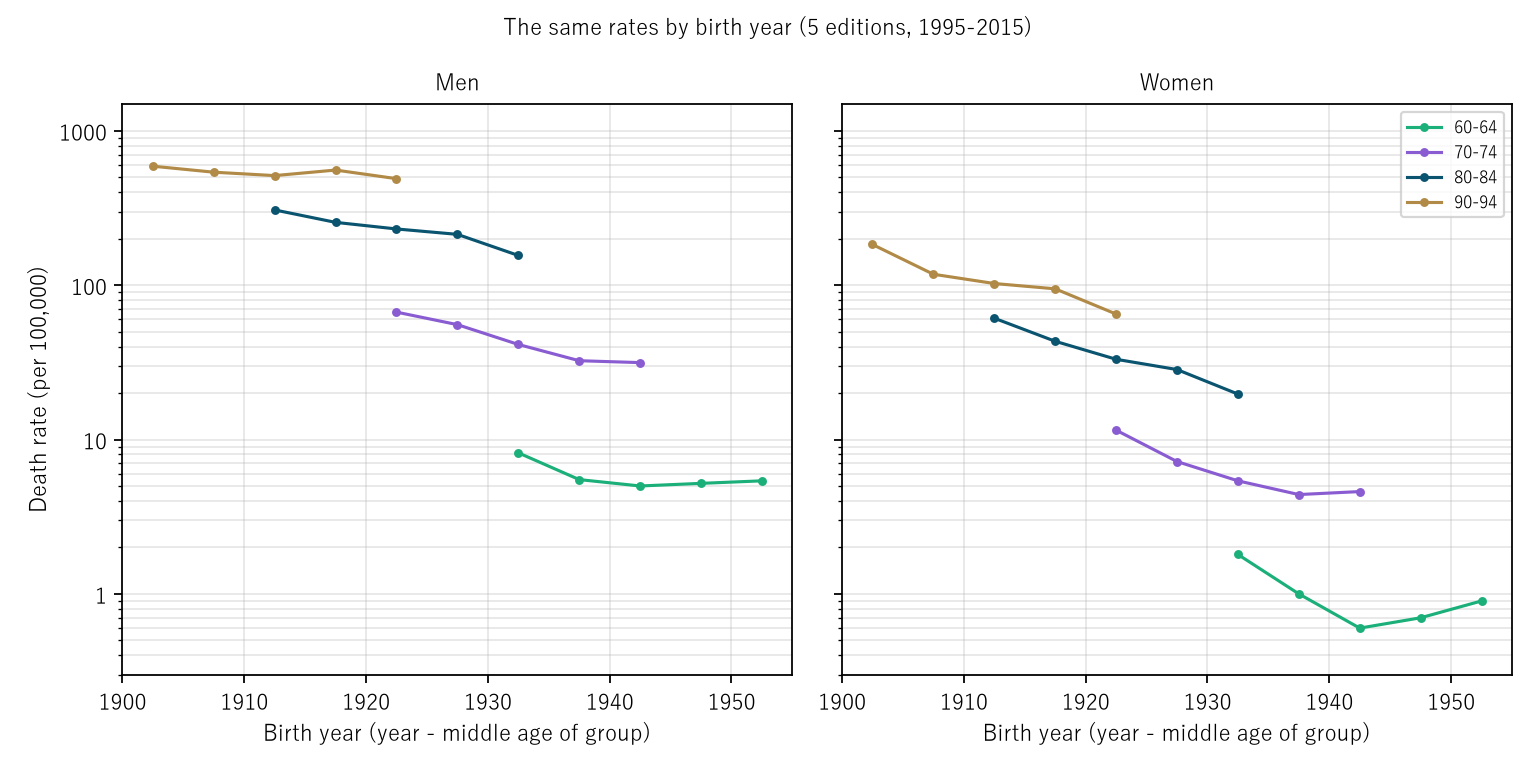
Figure 2: Age-specific death rates for 1995–2015 arranged by birth year (year − middle age of the group).
7. Classification changes
Observation 7.1: From 1990 to 1995 (application of ICD-10), age-standardized death rates jumped from 38 to 48.1 for men (1.266 times) and from 9.7 to 11.1 for women (1.144 times). With the application of the 2013 version in 2017, COPD is counted 1.206 times on the same death records. From 2015 to 2020, age-standardized rates became 0.886 times for men and 0.744 times for women, or 0.735 and 0.617 times when divided by the new/old ratio. This paper's comparison was made within 1995–2015, avoiding both changes.
8. Limitations
- The linear slopes of year, birth year, and age cannot be separated. What was compared is the curved shape.
- The tables are in 5-year steps, so birth years are also 5-year steps (an approximation spanning 10-year bands).
- Only 5 editions (40 cells) were compared, not a large number of cells.
- It does not go into why the shape differs between men and women.
- It is not one person's likelihood.
Conclusion
In 1995–2015, COPD death rates for men leave a remainder cut to 1/3.24 when aligned by birth year, while for women the cut is only 1/1.25. Women's rates fell together to 0.28–0.40 times at every age from 65; men's fell less at older ages; and the men-to-women ratio of age-standardized rates widened from 4.33 to 7.44.
One thing separates them — whether rates line up by year or by birth year.
When hearing that "the death rate from a disease fell," check together, separately for men and women, whether it fell together at every age or whether differences between birth years remain.
Data and reproduction
| Data | Vital Statistics special report, age-standardized death rates by prefecture (2015 model population), Table 33 (9 editions 1980–2020, e-Stat, retrieved 26 September 2026); the Ministry of Health, Labour and Welfare's "Effects of the partial revision of ICD-10 on cause-of-death statistics" and the 2017 overview of monthly vital statistics annual estimates (retrieved the same day) |
| Terms of use | e-Stat follows the Public Data License (Version 2.0), and the Ministry's pages the Public Data License (Version 1.0). This paper's ratios and fits were produced by processing these and are not figures produced by the government |
| Scope | Japan (national); by sex; ages 55–94; 1980–2020 (compared: 1995–2015) |
| Verification | 検算/M044.py (--zu also writes the figures). Every number in the text is taken from 検算/M044_output.txt |
| Raw data | The 11 retrieved files and SOURCES.md (URLs, retrieval dates, SHA-256, terms of use, definitions and calculation) in data/ |
| Figures | 図/M044_zu1, 図/M044_zu2 (png, svg, English versions) |
References
- Ministry of Health, Labour and Welfare. Effects of the partial revision of ICD-10 on cause-of-death statistics (in Japanese) (accessed 26 September 2026). https://www.mhlw.go.jp/toukei/list/dl/icd_2013_eikyo.pdf
- Ministry of Health, Labour and Welfare. Overview of the 2017 monthly vital statistics annual estimates: Summary of results (in Japanese) (accessed 26 September 2026). https://www.mhlw.go.jp/toukei/saikin/hw/jinkou/geppo/nengai17/dl/kekka.pdf
- Ministry of Health, Labour and Welfare. Vital Statistics special report: Age-standardized death rates by prefecture (2015 model population), 1980–2020, Table 33 (in Japanese). e-Stat (accessed 26 September 2026). https://www.e-stat.go.jp/
- Yamagishi, Y. (2026). Life Expectancy Is Not the Number of Years Anyone Actually Lives [M003]. Zenodo. https://doi.org/10.5281/zenodo.22963485
- Yamagishi, Y. (2026). The Peaks of Men's Liver Cancer Death Rates Line Up by Birth Year, While Those of Lung and Colorectal Cancer Line Up by Year — For Men's Liver Cancer the Peak Years of Eight Age Groups Spread over 28.5 Years, Yet Their Birth Years Fall Within 6.5 Years [M033]. Zenodo. https://doi.org/10.5281/zenodo.22972855
- Yamagishi, Y. (2026). The Fall in Pneumonia Deaths in 2017 Is Nearly Predicted by the Ratio from Recoding the Same Death Records under the New and Old Classifications — for Pneumonia, an Actual Step of 0.826 Against a New/Old Ratio of 0.810, a Correlation of 0.969 Across 65 Causes, and the Lost Deaths Moved to Dementia, Alzheimer's Disease, Heart Failure, COPD, and Others [M041]. Zenodo. https://doi.org/10.5281/zenodo.22974374
Reference
Yamagishi, Y. (2026). COPD Death Rates Line Up by Birth Year for Men but Hardly for Women [M044]. Zenodo.
DOI: 10.5281/zenodo.22974498
YOI: https://www.yamagishiyuuki.com/yoi/M044
ORCID: 0009-0006-8587-3450
PDF (English) · PDF (Japanese) · Date proof of the English PDF (OpenTimestamps .ots) · SHA256SUMS
The record page for this paper (in Japanese, with the PDFs in each language and the date proof): YOI M044. This paper is a preprint and has not been peer reviewed.