Abstract
This paper sets side by side six numbers from four surveys that are all counted under the one phrase "people with diabetes": from the National Health and Nutrition Survey (2023), people "strongly suspected by test" and people "ever told they have it"; from the Comprehensive Survey of Living Conditions (2025), people "visiting a clinic"; from the Patient Survey (2023), people "in care on the survey day" (main diagnosis, and main or secondary diagnosis); and from the Vital Statistics (2023), "deaths in a year." All are aligned per 100,000 people, both sexes, at ages 40–49, 50–59, 60–69, and 70+. It claims no new mathematical theorem and no new law.
First, the tables are consistent. Percentages equal count ÷ total, totals lie between men and women, "70 and over (restated)" lies between the values of the 5-year groups, and the 5-year groups of Table 163 add up to the total (Section 3).
Second, this is the core of the paper. The same "people with diabetes" changes by orders of magnitude with what is counted. Per 100,000 at 70+: strongly suspected by test 19,500, ever told 22,400, visiting a clinic 12,130, in care that day 449 (main) and 1,948 (main or secondary), deaths in a year 44.8 (Section 4).
Third, the ratios between the numbers also move with age. People ever told are 1.15–1.65 times those strongly suspected; people visiting a clinic are 0.39–0.69 times. Of those in care that day who have diabetes, only 1 in 2.72–4.34 are there mainly for diabetes (Section 5).
Fourth, the speed of the rise with age also differs with what is counted. From 40–49 to 70+, strongly suspected rises 3.8-fold, ever told 3.1-fold, visiting a clinic 6.0-fold, in care 6.5–10.3-fold, and deaths in a year 29.4-fold (Section 6).
Fifth, the survey years of the four surveys differ (2023 and 2025). The National Health and Nutrition Survey is a sample of a few hundred per age group; ages 20–39 and the split by sex have cells below 10 people and were left out (Section 3).
Sixth, what separates them is what is counted (test, self-report, care, cause of death). The number heard as "X million people with diabetes" differs 435–3,408-fold even at the same age depending on the yardstick.
Scope note: This paper claims no new mathematical theorem and no new law — all the numbers are in published tables; the paper only aligns them to the same unit and sets them side by side. This paper is a structural interpretation of the shape of numbers in published aggregate data, and is not medical advice, diagnosis, or a treatment recommendation. The author is not a physician. For decisions about individual health, consult a physician or medical institution. It is a preprint that has not been peer reviewed. It does not argue which number is right — the six count different things. It does not go into diagnostic criteria or the merits of treatment. The survey years (2023 and 2025) and subjects (sample, households, medical institutions, death records) are not the same. It is not one person's likelihood. Prefectures, regions, and medical institutions are not compared. About the data: the National Health and Nutrition Survey, the Comprehensive Survey of Living Conditions, the Patient Survey, and the Vital Statistics on e-Stat are used under the Public Data License (Version 2.0); this paper's numbers and ratios were produced by processing them. What the paper adds: aligning the six numbers for "people with diabetes" to the same unit and ages, and showing the differences in magnitude and in the rise with age.
1. Notation and question
- Strongly suspected by test: Table 54 of the National Health and Nutrition Survey. People with HbA1c (NGSP) of 6.5% or more, or who report current treatment (table note).
- Ever told they have it: "Yes" in Table 50, "whether ever told of diabetes," of the same survey.
- Visiting a clinic: the rate of people visiting a clinic in Table 108 of the Comprehensive Survey of Living Conditions (inpatients not included).
- In care that day: the survey day of the Patient Survey (October 2023). Main diagnosis (treatment rate in Table 68) and main or secondary diagnosis (estimated patients in Table 163 ÷ population).
- Deaths in a year: diabetes deaths in Table 5.15 of the Vital Statistics (2023).
- All per 100,000 people. Tables in 5-year groups were combined into 10-year groups weighted by the 2023 population (all-cause deaths ÷ death rate in Table 5.15).
Question: how much does the number of "people with diabetes" differ with what is counted, and how does it differ by age?
Observation 1.1: M007 showed that the one phrase "5-year survival" points to three different numbers, and M039 that the share of "people with hypertension" moves 2.32-fold with the height of the line and how medication is counted. This paper sets side by side six numbers from different surveys for "people with diabetes."
2. Survey and design
Stated honestly: the design was set after seeing the tables.
| Content | |
|---|---|
| Test and self-report | National Health and Nutrition Survey 2023, Tables 54 and 50 |
| Clinic visits | Comprehensive Survey of Living Conditions 2025, Table 108 |
| Care | Patient Survey 2023, Table 68 (main diagnosis) and Table 163 (main or secondary diagnosis) |
| Deaths | Vital Statistics 2024, Volume 1, Table 5.15 (the 2023 column) |
| Ages | 40–49, 50–59, 60–69, 70+, where the National Health and Nutrition Survey has 10 or more "strongly suspected" |
| Noticed along the way | When reading age labels, "65 and over (restated)" was taken as 65–69, overwriting the value for 60–69. The check that the 5-year groups of Table 163 add up to the total failed and revealed it; "X and over" labels were then read as separate labels |
3. Data and checks
Calculation 3.1 The 6 retrieved files were fixed by SHA-256, and the following was checked.
- The criterion in Table 54 is HbA1c (NGSP) of 6.5% or more, or current treatment. Percentages in Tables 54 and 50 = count ÷ total (one decimal). The "strongly suspected," both sexes, number 13 at 40–49, 31 at 50–59, 59 at 60–69, and 162 at 70+ (0 at 20–29 and 3 at 30–39; by sex at 40–49, 6 and 7).
- Tables 108 and 68: totals lie between men and women, and "70 and over (restated)" lies between the values of the 5-year groups from 70–74.
- Table 163: the 5-year groups and unknown add up to 828.8 thousand = total 828.9 thousand (within rounding).
- Diabetes death rates recomputed from the population = the rates in Table 5.15 (2023).
4. Core — six numbers
Calculation 4.1 Six numbers for "people with diabetes" (per 100,000, both sexes)
| Age | Strongly suspected by test | Ever told | Visiting a clinic | In care that day (main) | In care that day (main or secondary) | Deaths in a year |
|---|---|---|---|---|---|---|
| 40–49 | 5,200 | 7,200 | 2,010 | 69 | 189 | 1.5 |
| 50–59 | 8,200 | 13,500 | 4,696 | 152 | 450 | 4.0 |
| 60–69 | 12,700 | 17,300 | 8,768 | 296 | 975 | 10.3 |
| 70+ | 19,500 | 22,400 | 12,130 | 449 | 1,948 | 44.8 |
Observation 4.2: Per 100,000 at 70+: strongly suspected by test 19,500, ever told 22,400, visiting a clinic 12,130, in care that day 449 (main) and 1,948 (main or secondary), deaths in a year 44.8. At every age the order is strongly suspected > in care that day (main or secondary) > deaths in a year, and those strongly suspected are 435–3,408 times the deaths in a year.
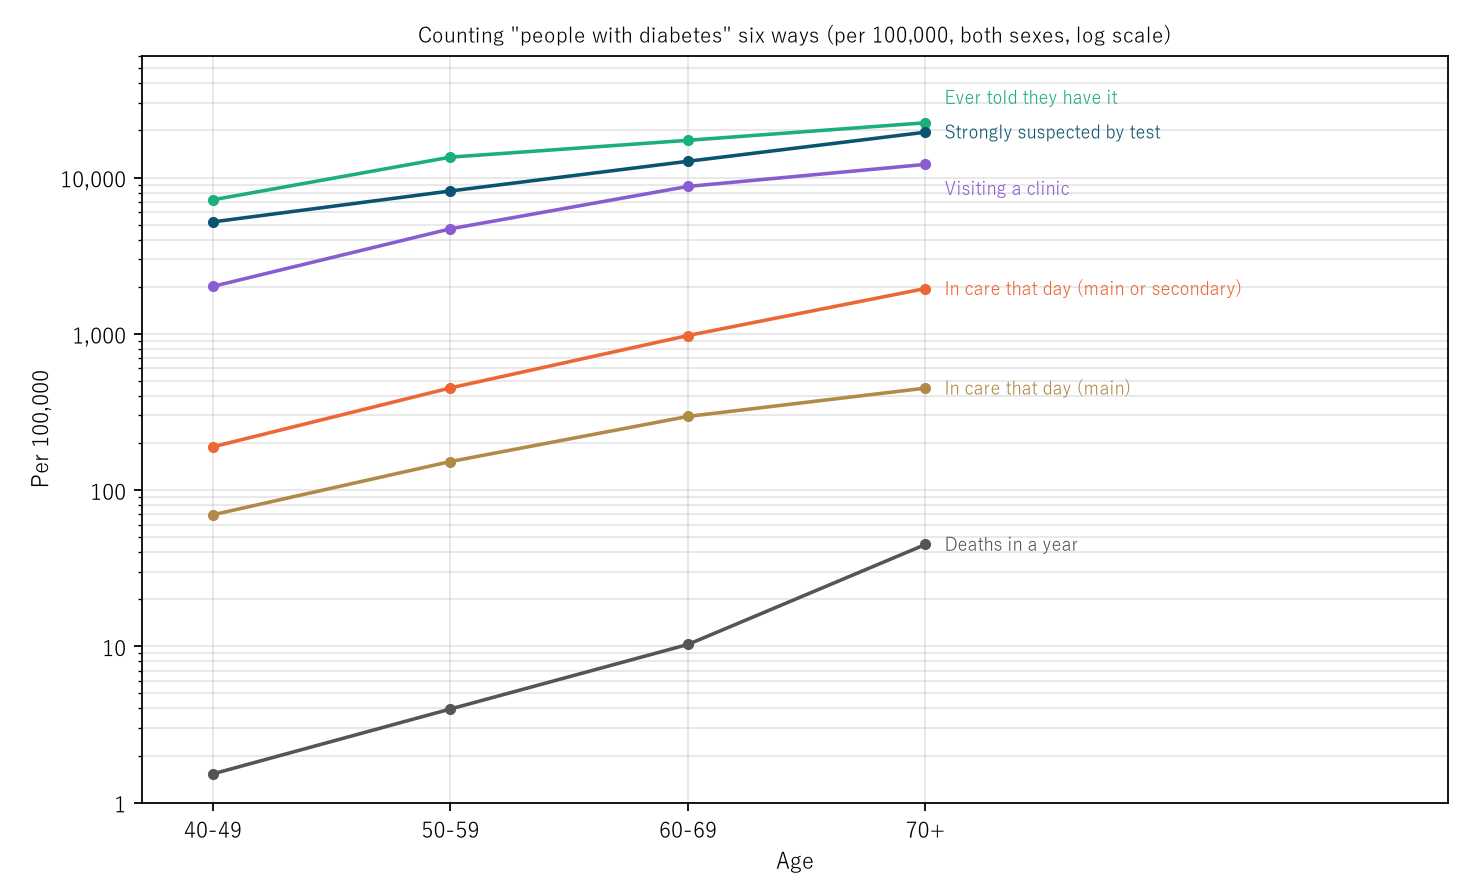
Figure 1: The six numbers by age (vertical log scale). The top three lines (strongly suspected, ever told, visiting a clinic) run close together; care lies below them, and deaths lower still, rising most steeply.
5. Ratios between the numbers
Calculation 5.1 Ratios between the numbers
| Age | Ever told ÷ strongly suspected | Clinic ÷ strongly suspected | Care (main or secondary) ÷ care (main) | Clinic ÷ care (main or secondary) | Strongly suspected ÷ deaths |
|---|---|---|---|---|---|
| 40–49 | 1.38 | 0.39 | 2.72 | 10.6 | 3,408 |
| 50–59 | 1.65 | 0.57 | 2.96 | 10.4 | 2,066 |
| 60–69 | 1.36 | 0.69 | 3.29 | 9.0 | 1,236 |
| 70+ | 1.15 | 0.62 | 4.34 | 6.2 | 435 |
Observation 5.2: People ever told they have diabetes are 1.15–1.65 times those strongly suspected by test (some who were told are not in the current criterion). People visiting a clinic are 0.39–0.69 times those strongly suspected. People in care that day who have diabetes (main or secondary) are 2.72–4.34 times those in care mainly for diabetes, and this ratio is largest at 70+.
6. The rise with age
Calculation 6.1 The rise from 40–49 to 70+
| Number | 40–49 | 70+ | Ratio |
|---|---|---|---|
| Strongly suspected by test | 5,200.0 | 19,500.0 | 3.8× |
| Ever told they have it | 7,200.0 | 22,400.0 | 3.1× |
| Visiting a clinic | 2,009.6 | 12,130.0 | 6.0× |
| In care that day (main) | 69.5 | 449.0 | 6.5× |
| In care that day (main or secondary) | 189.1 | 1,948.2 | 10.3× |
| Deaths in a year | 1.5 | 44.8 | 29.4× |
Observation 6.2: Deaths in a year rise 29.4-fold from 40–49 to 70+, far more than the other five (3.1–10.3-fold). Even for the same disease name, the speed of the rise with age differs with what is counted.
7. Limitations
- The survey years differ (clinic visits 2025, the others 2023). The population weights are the 2023 population throughout.
- The National Health and Nutrition Survey is a sample survey, with a few hundred people per age group.
- The six count different things (test values, self-report, household report, medical-institution records, death records). Whether the same people are counted in several is not known from the tables.
- Sexes are not separated (cells of the National Health and Nutrition Survey become too small).
- It does not argue which number is right. It is not one person's likelihood.
Conclusion
The number of "people with diabetes" changes by orders of magnitude with what is counted: per 100,000 at 70+, from 19,500 strongly suspected by test to 44.8 deaths in a year. The speed of the rise with age also differs, from 3.1-fold for those ever told to 29.4-fold for deaths in a year.
One thing separates them — what is counted (test, self-report, care, cause of death).
When hearing that "X million people have the disease," check together whether it is a test count, a self-report, a count of care, or a count of deaths.
Data and reproduction
| Data | National Health and Nutrition Survey 2023, Tables 54 and 50; Comprehensive Survey of Living Conditions 2025, Table 108; Patient Survey 2023, Tables 68 and 163; Vital Statistics 2024 (final data), Volume 1, Table 5.15 (e-Stat, retrieved 26 September 2026) |
| Terms of use | e-Stat follows the Public Data License (Version 2.0). This paper's numbers and ratios were produced by processing these and are not figures produced by the government |
| Scope | Japan; both sexes; ages 40 and over; 2023 (clinic visits 2025) |
| Verification | 検算/M045.py (--zu also writes the figure). Every number in the text is taken from 検算/M045_output.txt |
| Raw data | The 6 retrieved files and SOURCES.md (URLs, retrieval dates, SHA-256, terms of use, definitions and calculation) in data/ |
| Figures | 図/M045_zu1 (png, svg, English version) |
References
- Ministry of Health, Labour and Welfare. Comprehensive Survey of Living Conditions 2025, Health, Table 108 (in Japanese). e-Stat (accessed 26 September 2026). https://www.e-stat.go.jp/
- Ministry of Health, Labour and Welfare. National Health and Nutrition Survey 2023, Tables 50 and 54 (in Japanese). e-Stat (accessed 26 September 2026). https://www.e-stat.go.jp/
- Ministry of Health, Labour and Welfare. Patient Survey 2023, National, Tables 68 and 163 (in Japanese). e-Stat (accessed 26 September 2026). https://www.e-stat.go.jp/
- Ministry of Health, Labour and Welfare. Vital Statistics 2024 (final data), Volume 1, Table 5.15 (in Japanese). e-Stat (accessed 26 September 2026). https://www.e-stat.go.jp/
- Yamagishi, Y. (2026). "5-Year Survival" Is One Phrase for Three Different Numbers [M007]. Zenodo. https://doi.org/10.5281/zenodo.22964570
- Yamagishi, Y. (2026). The Share of "People with Hypertension" Moves 2.32-Fold with the Height of the Line and How Medication Is Counted — From 27.6% to 64.2% of Adults Aged 20+ in the 2023 Survey; Lowering the Line Adds More at Ages 20–49, Counting Medication Adds More at 70+ [M039]. Zenodo. https://doi.org/10.5281/zenodo.22974218
Reference
Yamagishi, Y. (2026). The Number of "People with Diabetes" Changes by Orders of Magnitude with What Is Counted [M045]. Zenodo.
DOI: 10.5281/zenodo.22974556
YOI: https://www.yamagishiyuuki.com/yoi/M045
ORCID: 0009-0006-8587-3450
PDF (English) · PDF (Japanese) · Date proof of the English PDF (OpenTimestamps .ots) · SHA256SUMS
The record page for this paper (in Japanese, with the PDFs in each language and the date proof): YOI M045. This paper is a preprint and has not been peer reviewed.