Abstract
This paper checks whether the distribution of HbA1c in the Specific Health Checkups (fiscal 2022) only shifts to the right with its mean as age rises, or also changes shape, using the "HbA1c distribution by prefecture, sex, and age group" (6 bands × men and women × 5-year groups from 40 to 74) and the "mean of each item" of the 10th NDB Open Data. The national figure was obtained by adding the 47 prefectures and the people whose prefecture could not be determined (23,557,356 people). It claims no new mathematical theorem and no new law.
First, the tables are consistent. The subtotals equal the sum of the 5-year groups, and 36 cells are suppressed as below 10 (at most 324 people could not be added) (Section 3).
Second, the mean rises slowly with age. From 40–44 to 70–74, men 5.485 → 5.911 (+0.426), women 5.378 → 5.797 (+0.419) (Section 4).
Third, this is the core of the paper. How fast the share above a line rises depends on the height of the line. From 40–44 to 70–74, for men: 5.6 or above 2.16-fold, 6.0 or above 4.76-fold, 6.5 or above 5.11-fold, 8.0 or above 1.77-fold, 8.4 or above 1.35-fold; the middle line rises most (for women too, 6.5 or above rises most, 7.87-fold) (Section 5).
Fourth, compared with a prediction that shifts the 40–44 distribution to the right by the difference in mean alone, 6.5 or above is predicted at 6.67% but is actually 16.34% for men (2.45 times), and predicted at 3.26% but actually 9.14% for women (2.81 times). For men, 8.4 or above is predicted at 1.11% and is actually 1.17% (1.05 times), almost as predicted; for women it is 1.64 times (Section 6).
Fifth, for men the share at 8.4 or above is highest at 55–59 (1.58%), and lower at 70–74 (1.17%). The mean keeps rising, but the far end of the tail stops increasing partway (Section 4).
Sixth, what separates them is whether the mean shifted or the shape of the distribution changed. For HbA1c, with age the region around 6.0–8.0 swells more than the shift of the mean, and the very top end does not increase as much.
Scope note: This paper claims no new mathematical theorem and no new law — the counts and means are in the NDB Open Data; the paper only compares the share above each line with a prediction from the shift of the mean alone. This paper is a structural interpretation of the shape of numbers in published aggregate data, and is not medical advice, diagnosis, or a treatment recommendation. The author is not a physician. For decisions about individual health, consult a physician or medical institution. It is a preprint that has not been peer reviewed. It does not go into why the shape of the distribution changes (treatment, who attends the checkups, aging, and so on). These are counts of people who attended the Specific Health Checkups, not shares of the whole national population — who attends differs with age. The prediction assumes the people within a band are spread evenly, and is coarse because the bands (especially 6.5–8.0) are wide. It is not one person's outlook. Prefectures are only added to make the national figure and are not compared. About the data: the 10th NDB Open Data (Ministry of Health, Labour and Welfare) is used under the Public Data License (Version 1.0); this paper's shares, means, and predictions were produced by processing it. What the paper adds: showing that the rise of the share above an HbA1c line differs with the height of the line, and separating the change in the shape of the distribution by comparison with a prediction from the shift of the mean alone.
1. Notation and question
- Share above a line: the share of people whose HbA1c (NGSP) is 5.6, 6.0, 6.5, 8.0, or 8.4 or above (band counts added and divided by the total).
- National mean: the prefectural means weighted by the counts in the distribution table.
- Prediction from the shift of the mean alone: the share above a line when the 40–44 distribution is moved to the right by the difference in mean from 70–74. People within a band are assumed to be spread evenly (the cumulative share is joined by straight lines). It is computed for 6.5, 8.0, and 8.4, where the moved line falls inside a band.
Question: Does the HbA1c distribution only shift to the right with its mean as age rises?
Observation 1.1: M040 showed that the share of people with systolic blood pressure of 140 or above is nearly determined by that year's mean (the distribution shifts while keeping its shape). This paper puts the same question to HbA1c and shows that a different answer comes out. M045 showed that the number of "people with diabetes" changes by orders of magnitude with what is counted (HbA1c of 6.5% or above is used in one of those yardsticks).
2. Survey and design
To be honest: the design was decided after seeing the tables.
| Content | |
|---|---|
| Distribution | 10th NDB Open Data, Specific Health Checkups, "HbA1c distribution by prefecture, sex, and age group" (fiscal 2022, 6 bands) |
| Mean | The HbA1C row of "mean of each item by prefecture, sex, and age group" in the same data |
| Yardsticks | Share above a line, the fold change from 40–44 to 70–74, and the ratio to the prediction from the shift of the mean alone |
| National figure | There is no national row, so the 47 prefectures and the undetermined were added |
| Prediction and measurement | I expected the actual share at 8.4 or above to be less than 1.2 times the prediction for both sexes. Measured, it was 1.05 times for men and 1.64 times for women, so the expectation failed for women |
3. Data and checks
Calculation 3.1 The 3 retrieved files (a copy of the page and the two tables) were fixed by SHA-256, and the following was checked.
- The copy of the page contains the locations of the two tables (HbA1c and the mean of each item). The table headings are "特定健診(HbA1C):2022年度" and "特定健診 平均値:2022年度".
- The age headings are the seven groups from 40 to 74 and a subtotal for both sexes. The prefectural blocks number 48: 47 prefectures and the undetermined. Subtotal = sum of the seven 5-year groups (rows with no suppressed cell).
- The total added is 23,557,356 people. There are 36 cells suppressed as below 10, and at most 324 people could not be added (fewer than one in ten thousand of the total).
4. Mean and share above a line
Calculation 4.1 Mean by age and the shares at 6.5 or above and 8.4 or above (%)
| Age | Men: mean | Men: 6.5+ | Men: 8.4+ | Women: mean | Women: 6.5+ | Women: 8.4+ |
|---|---|---|---|---|---|---|
| 40–44 | 5.485 | 3.20 | 0.87 | 5.378 | 1.16 | 0.25 |
| 45–49 | 5.580 | 5.32 | 1.21 | 5.439 | 1.83 | 0.34 |
| 50–54 | 5.677 | 8.01 | 1.52 | 5.548 | 2.94 | 0.49 |
| 55–59 | 5.760 | 10.74 | 1.58 | 5.645 | 4.29 | 0.56 |
| 60–64 | 5.821 | 12.97 | 1.45 | 5.699 | 5.68 | 0.56 |
| 65–69 | 5.873 | 14.78 | 1.33 | 5.748 | 7.28 | 0.54 |
| 70–74 | 5.911 | 16.34 | 1.17 | 5.797 | 9.14 | 0.54 |
Observation 4.2: For both sexes the mean rises with age, and so do the shares at 5.6, 6.0, and 6.5 or above. Yet for men the share at 8.4 or above is highest at 55–59, 1.58%, and falls to 1.17% at 70–74. For men, 8.0 or above is also highest at 55–59. For women the share at 8.4 or above hardly moves from 55–59 on, staying at 0.54–0.56%.
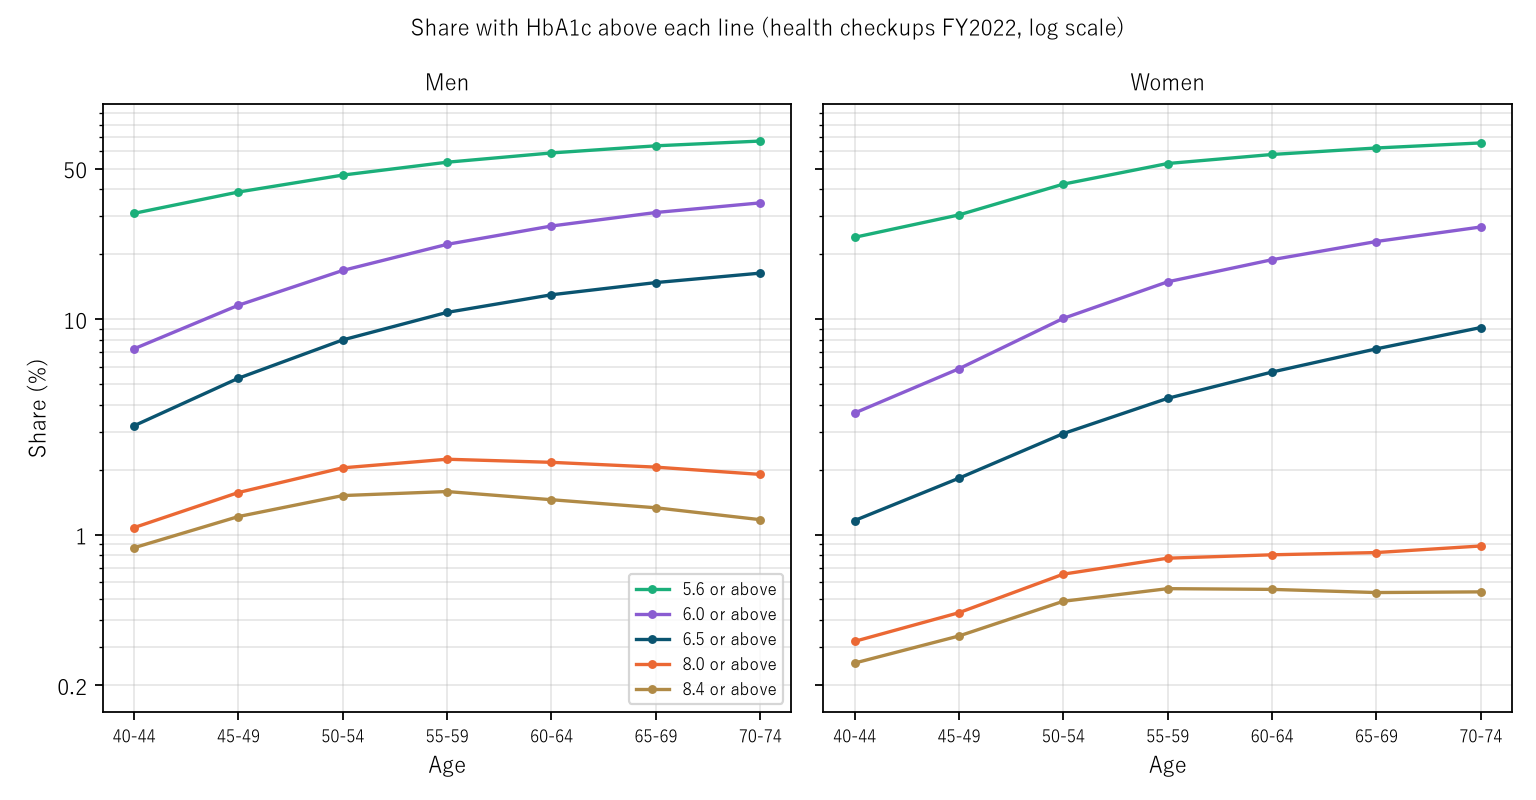
Figure 1: Share of people above each line (5.6, 6.0, 6.5, 8.0, 8.4; vertical axis logarithmic). For men the bottom two lines (8.0 and 8.4 or above) fall from 55–59 on. For women 8.4 or above levels off from 55–59, and 8.0 or above keeps rising slowly.
5. Core — the rise differs with the height of the line
Calculation 5.1 Fold change from 40–44 to 70–74
| Men | Women | |
|---|---|---|
| Difference in mean | +0.426 | +0.419 |
| 5.6 or above | 2.16× | 2.74× |
| 6.0 or above | 4.76× | 7.30× |
| 6.5 or above | 5.11× | 7.87× |
| 8.0 or above | 1.77× | 2.77× |
| 8.4 or above | 1.35× | 2.14× |
Observation 5.2: The fold change is largest at the middle line (6.5 or above: 5.11-fold for men, 7.87-fold for women). The low line (5.6 or above) rises only 2.16-fold and 2.74-fold, and the high line (8.4 or above) 1.35-fold and 2.14-fold. The difference in mean is only +0.426 for men and +0.419 for women.
6. Predicting from the shift of the mean alone
Calculation 6.1 Ages 70–74: prediction from the shift of the mean alone and the actual share (%)
| Line | Men: predicted | Men: actual (÷ predicted) | Women: predicted | Women: actual (÷ predicted) |
|---|---|---|---|---|
| 6.5 or above | 6.67 | 16.34 (2.45×) | 3.26 | 9.14 (2.81×) |
| 8.0 or above | 1.68 | 1.90 (1.13×) | 0.55 | 0.89 (1.60×) |
| 8.4 or above | 1.11 | 1.17 (1.05×) | 0.33 | 0.54 (1.64×) |
Observation 6.2: At 6.5 or above, the prediction is 6.67% but the actual is 16.34% for men (2.45 times), and 3.26% against 9.14% for women (2.81 times). If the distribution had only shifted to the right while keeping its shape, the actual would come near the prediction. At 8.4 or above the ratio is 1.05 for men, almost as predicted, and 1.64 for women, both smaller than at 6.5 or above. With age, the region around 6.0–8.0 swells more than the shift of the mean. This is a different shape from the blood pressure of M040 (where the share at 140 or above is nearly determined by the mean).
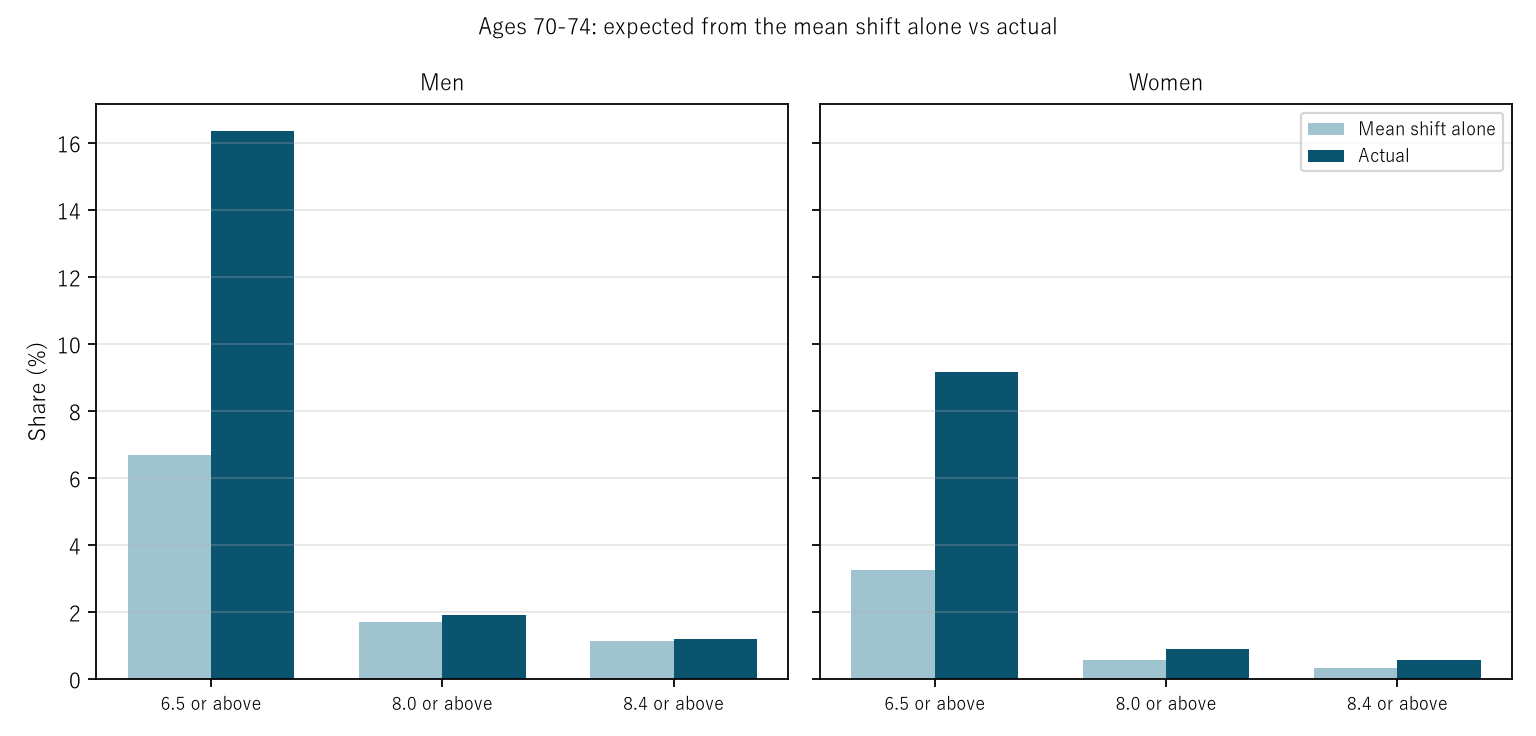
Figure 2: Share above each line at 70–74. Light blue is the prediction from the shift of the mean alone, navy is the actual share. The gap is large at 6.5 or above.
7. Limitations
- These are counts of people who attended the Specific Health Checkups (ages 40–74). Who attends differs with age, and the shares are not those of the whole national population.
- The prediction assumes people are spread evenly within a band. The 6.5–8.0 band is wide, and the prediction moves with the shape inside it.
- It looks at differences between ages in one fiscal year (2022), not at the change in the same people as they age (differences between birth years are also included).
- It does not go into why the shape changed.
- Prefectures are not compared. It is not one person's outlook.
Conclusion
In the 2022 Specific Health Checkups, the mean HbA1c rises only 0.426 (men) from 40–44 to 70–74, yet people at 6.5 or above increase 5.11-fold, and against a prediction of 6.67% from the shift of the mean alone the actual is 16.34%. For men, people at 8.4 or above are, if anything, most common at 55–59.
One thing separates them — whether the mean shifted or the shape of the distribution changed.
When you hear "the mean has risen only a little," check together how the share above a line moved, changing the height of the line.
Data and reproduction
| Data | 10th NDB Open Data (Ministry of Health, Labour and Welfare), Specific Health Checkups, "HbA1c distribution by prefecture, sex, and age group" and "mean of each item by prefecture, sex, and age group" (fiscal 2022, retrieved 26 September 2026) |
| Terms of use | The Ministry of Health, Labour and Welfare pages follow the Public Data License (Version 1.0). This paper's shares, means, and predictions were produced by processing these and are not figures produced by the government |
| Scope | Japan (national figure from the 47 prefectures and the undetermined); attendees of the Specific Health Checkups aged 40–74; fiscal 2022 |
| Verification | 検算/M046.py (--zu also writes the figures). Every number in the text is taken from 検算/M046_output.txt |
| Raw data | The 3 retrieved files and SOURCES.md (URLs, retrieval dates, SHA-256, terms of use, definitions and calculation) in data/ |
| Figures | 図/M046_zu1 and 図/M046_zu2 (png, svg, English version) |
References
- Ministry of Health, Labour and Welfare. 10th NDB Open Data, Specific Health Checkups (HbA1c distribution by prefecture, sex, and age group; mean of each item by prefecture, sex, and age group) (in Japanese) (accessed 26 September 2026). https://www.mhlw.go.jp/stf/seisakunitsuite/bunya/0000177221_00016.html
- Yamagishi, Y. (2026). The Share of People with Systolic Blood Pressure of 140 or Above Is Nearly Determined by That Year's Mean — Across 8 Surveys from 2013 to 2023 at Ages 50+, the Share Fitted from the Mean Alone Misses by a Spread of 1.76 Points, and the Largest Drop in the Mean Falls in 2018→2019, the Year the Device Changed, in 4 of 6 Cells [M040]. Zenodo. https://doi.org/10.5281/zenodo.22974334
- Yamagishi, Y. (2026). The Number of "People with Diabetes" Changes by Orders of Magnitude with What Is Counted — Per 100,000 at 70+, 19,500 Strongly Suspected by Test, 12,130 Visiting a Clinic, 449–1,948 in Care on the Survey Day, and 44.8 Deaths a Year; the Rise from 40–49 Also Ranges from 3.1-Fold to 29.4-Fold [M045]. Zenodo. https://doi.org/10.5281/zenodo.22974556
Reference
Yamagishi, Y. (2026). The Mean HbA1c Rises Only 0.426 from Ages 40–44 to 70–74, Yet People at 6.5 or Above Increase 5.11-Fold [M046]. Zenodo.
DOI: 10.5281/zenodo.22974590
YOI: https://www.yamagishiyuuki.com/yoi/M046
ORCID: 0009-0006-8587-3450
PDF (English) · PDF (Japanese) · Date proof of the English PDF (OpenTimestamps .ots) · SHA256SUMS
The record page for this paper (in Japanese, with the PDFs in each language and the date proof): YOI M046. This paper is a preprint and has not been peer reviewed.