Abstract
This paper checks how much the number of people below a single line of 60 on eGFR in the Specific Health Checkups (fiscal 2022) differs with age, and where that difference comes from, using the "eGFR," "serum creatinine," "CGA classification," and "mean of each item" tables (distribution by prefecture, sex, and age group) of the 10th NDB Open Data. For eGFR, the equation in the abstract of Matsuo et al. (2009) was used (194 × creatinine^(−1.094) × age^(−0.287), × 0.739 for women). It claims no new mathematical theorem and no new law.
First, the tables are consistent. In every table there are 48 prefectural blocks and the subtotals equal the sum of the 5-year groups, and between the two extractions (※1 and ※2) the share below 60 differs by at most 3.17 points in any cell. However, the number of people with eGFR is 0.446–0.901 of the number with HbA1c, smallest at 70–74 (Section 3).
Second, people below 60 increase with age. From 40–44 to 70–74: men 3.60 → 32.73% (9.08-fold), women 2.59 → 26.82% (10.36-fold). Of the people below 60, 84.1–96.6% are just under the line (45–60) (Section 4).
Third, this is the core of the paper. The eGFR equation contains age, and the numbers in the tables move as that equation says. In the 672 cells of prefecture × sex × age, the table's mean eGFR ÷ the equation (at the mean creatinine) lies within 1.0234–1.0767; removing the age term makes it drift with age, and removing the women's coefficient makes it 0.7652. From 40–44 to 70–74, men's mean creatinine rises only 0.868 → 0.915 (1.054 times), yet mean eGFR falls 79.79 → 66.21, and 0.829 of that decline on the log scale is the equation's age term (women 0.824) (Section 5).
Fourth, restated in the measured value (creatinine), the same line of 60 becomes a line that falls with age. For men, 1.097 at age 42 and 0.952 at age 72 (women 0.832 → 0.722). For men, whose table bands allow the comparison, the share with creatinine of 1.0 or above rises only 13.21 → 24.78% (1.88-fold), and the two counts swap order between 55–59 and 60–64 — the same place where the creatinine at eGFR 60 crosses 1.0 (Section 6).
Fifth, combined with urine protein in the CGA classification, 77.1–91.4% of people below the line have urine protein (−). The share with urine protein (+ or more) rises only 2.73-fold for men and 1.82-fold for women, and for women it is lowest at 55–59 (1.43%) (Section 7).
Sixth, what separates them is whether the line is drawn on the measured value or on a value converted with age. When a fixed line is drawn on a converted value that contains age, most of the increase with age in people below the line is what the equation brings in from age.
Scope note: This paper claims no new mathematical theorem and no new law — the counts and means are in the NDB Open Data, and the equation is in the abstract of the literature. The paper only counts the shares below the line and separates the part due to the equation's age term. This paper is a structural interpretation of the shape of numbers in published aggregate data, and is not medical advice, diagnosis, or a treatment recommendation. The author is not a physician. For decisions about individual health, consult a physician or medical institution. It is a preprint that has not been peer reviewed. It does not argue whether the line of 60 is good or whether the line should change with age. It does not say that the decline of eGFR with age is only apparent — the age term of the equation was made to fit GFR measured in the study that built the equation (inulin clearance; according to the abstract), and the paper does not go into how correctly it reflects each person's kidney function. People with eGFR are part of those who attended the Specific Health Checkups, and that part differs with age (0.446–0.901). It does not go into why the two extractions (※1 and ※2) differ. Each 5-year age group is represented by its middle age. It is not one person's outlook. Prefectures are only added to make the national figure and are not compared. About the data: the 10th NDB Open Data (Ministry of Health, Labour and Welfare) is used under the Public Data License (Version 1.0); this paper's shares, means, and conversions were produced by processing it. What the paper adds: separating the part of the increase with age in people below the eGFR line of 60 that is due to the equation's age term, and confirming with public tables that the same line, restated in creatinine, becomes a line that falls with age.
1. Notation and question
- eGFR: estimated glomerular filtration rate (mL/min/1.73 m²). A value converted from serum creatinine (mg/dL) and age by the equation in the abstract of Matsuo et al. (2009): eGFR = 194 × creatinine^(−1.094) × age^(−0.287) (× 0.739 for women).
- Share below a line: the share of people with eGFR below 60, 45, or 30.
- The equation's age term: age^(−0.287). Each 5-year group is represented by its middle age (42 for 40–44).
- Creatinine at eGFR 60: the creatinine value at which the equation gives exactly 60.
- CGA classification: a table combining the eGFR bands (G1 90 or above, G2 60–90, G3a 45–60, G3b 30–45, G4, G5) with urine protein (−, ±, + or more). This paper counts G3a–G5 as below the same line as "below 60."
Question: When a single line is drawn on a number that falls with age, how much does the number of people below the line differ with age? Where does that difference come from?
Observation 1.1: M039 showed that the share of "people with hypertension" moves with the height of the line. M046 separated, in HbA1c from the same NDB Open Data, the shift of the mean from the change in the shape of the distribution. This paper looks at a case where the quantity on which the line is drawn itself contains age.
2. Survey and design
To be honest: the design was decided after seeing the tables.
| Content | |
|---|---|
| Main tables | 10th NDB Open Data, Specific Health Checkups (※2): "eGFR" (5 bands), "serum creatinine" (5 bands), "CGA classification," and "mean of each item" (fiscal 2022) |
| Tables for cross-checking | (※1) "eGFR" (the same form from a different extraction) and "HbA1c" (a guide to the number of attendees) |
| Equation | The equation in the PubMed abstract of Matsuo et al. (2009) (checked with Crossref and PubMed) |
| Yardsticks | Share below a line, the fold change from 40–44 to 70–74, table mean ÷ equation, the split of the log decline, and the creatinine at eGFR 60 |
| Noticed while surveying | In the table of means, creatinine hardly rises while eGFR falls a lot. So the equation's age term was made the core |
3. Data and checks
Calculation 3.1 The 8 retrieved files (a copy of the page, six tables, and the PubMed record) were fixed by SHA-256, and the following was checked.
- The copy of the page contains the locations of the six tables, the note for (※1) (basic information records and checkup-result and questionnaire records) and the note for (※2) (those plus the detailed information records).
- The PubMed abstract contains the equation "194 x Serum creatinine(-1.094) x Age(-0.287) x 0.739 (if female)".
- In every table the 48 prefectural blocks (47 plus the undetermined), the age headings, and subtotal = sum of the 5-year groups hold. eGFR (※2) has 17,650,111 people and 156 suppressed cells (at most 1,404 people).
- The CGA count is 0.9850–0.9980 of the eGFR (※2) count, and the share in G3a–G5 differs from the share below 60 in the eGFR table by at most 0.10 points.
- Between (※1) and (※2), the share below 60 differs by at most 3.17 points in any cell.
- The eGFR (※2) count is 0.532–0.901 (men) and 0.446–0.798 (women) of the HbA1c count, smallest at 70–74 for both sexes.
4. Share below a line
Calculation 4.1 Share of people with eGFR below each line (%, ※2)
| Age | Men: below 60 | Men: below 45 | Men: below 30 | Women: below 60 | Women: below 45 | Women: below 30 |
|---|---|---|---|---|---|---|
| 40–44 | 3.60 | 0.21 | 0.09 | 2.59 | 0.10 | 0.03 |
| 45–49 | 6.80 | 0.42 | 0.16 | 5.17 | 0.17 | 0.06 |
| 50–54 | 11.09 | 0.79 | 0.27 | 9.47 | 0.38 | 0.11 |
| 55–59 | 16.15 | 1.38 | 0.38 | 14.06 | 0.67 | 0.15 |
| 60–64 | 21.32 | 2.25 | 0.49 | 17.55 | 1.01 | 0.17 |
| 65–69 | 26.25 | 3.31 | 0.54 | 20.92 | 1.57 | 0.21 |
| 70–74 | 32.73 | 5.20 | 0.72 | 26.82 | 2.77 | 0.30 |
Observation 4.2: Below 60 rises 3.60 → 32.73% (9.08-fold) for men and 2.59 → 26.82% (10.36-fold) for women. Of the people below 60, 84.1–96.6% are at 45–60, gathered just under the line. People at 90 or above decrease with age (men 0.26 times, women 0.23 times).
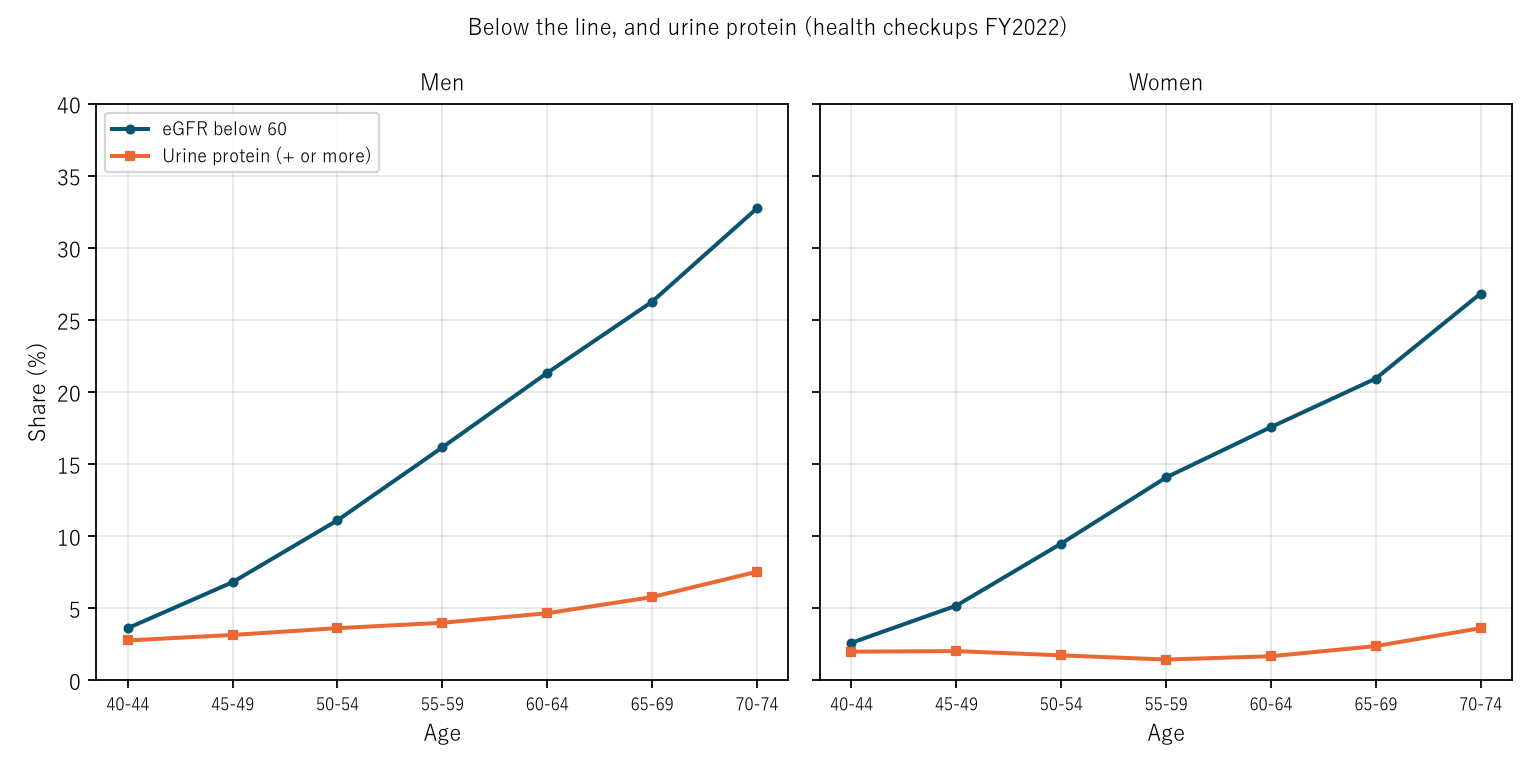
Figure 1: Share of people with eGFR below 60 (navy) and with urine protein (+ or more) (orange). Below 60 rises steeply with age, and the rise in urine protein does not reach a third of it (Section 7).
5. Core — the equation contains age
Calculation 5.1 Do the tables follow the equation? In the 672 cells of prefecture × sex × age, the table's mean eGFR is divided by the value the equation gives from the mean creatinine and the middle age.
- The ratio is 1.0234–1.0767 (median 1.0386). The equation of the mean and the mean of the equation do not agree, so it is not exactly 1.
- The maximum ÷ minimum of the median ratio by age is 1.027 for men and 1.014 for women. Removing the age term, 40–44 ÷ 70–74 drifts with age to 1.137 for men and 1.151 for women.
- Removing the women's coefficient 0.739, the median ratio for women becomes 0.7652 (men 1.0497).
Calculation 5.2 Mean eGFR and the prediction from the equation's age term alone (the 40–44 mean eGFR multiplied by (age ÷ 42)^(−0.287))
| Age | Men: mean eGFR | Men: age term alone | Men: creatinine at 60 | Women: mean eGFR | Women: age term alone | Women: creatinine at 60 |
|---|---|---|---|---|---|---|
| 40–44 | 79.79 | 79.79 | 1.097 | 82.43 | 82.43 | 0.832 |
| 45–49 | 76.76 | 77.26 | 1.065 | 78.89 | 79.81 | 0.807 |
| 50–54 | 74.19 | 75.05 | 1.037 | 75.32 | 77.53 | 0.786 |
| 55–59 | 71.83 | 73.10 | 1.012 | 72.55 | 75.51 | 0.768 |
| 60–64 | 70.05 | 71.36 | 0.990 | 71.29 | 73.71 | 0.751 |
| 65–69 | 68.29 | 69.78 | 0.970 | 70.07 | 72.09 | 0.736 |
| 70–74 | 66.21 | 68.36 | 0.952 | 68.31 | 70.61 | 0.722 |
Observation 5.3: From 40–44 to 70–74, mean creatinine rises only 0.868 → 0.915 (1.054 times) for men and 0.638 → 0.666 (1.044 times) for women. Mean eGFR falls 79.79 → 66.21 (0.830 times) for men and 82.43 → 68.31 (0.829 times) for women. Splitting the decline on the log scale (men −0.1866) gives age term −0.1547, creatinine term −0.0579, and remainder 0.0260, so the age term's part is 0.829 (women 0.824). The factor from the age term alone is (72 ÷ 42)^(−0.287) = 0.8567, and hardly changes, to 0.8579, if the middle ages are taken as 42.5 and 72.5.
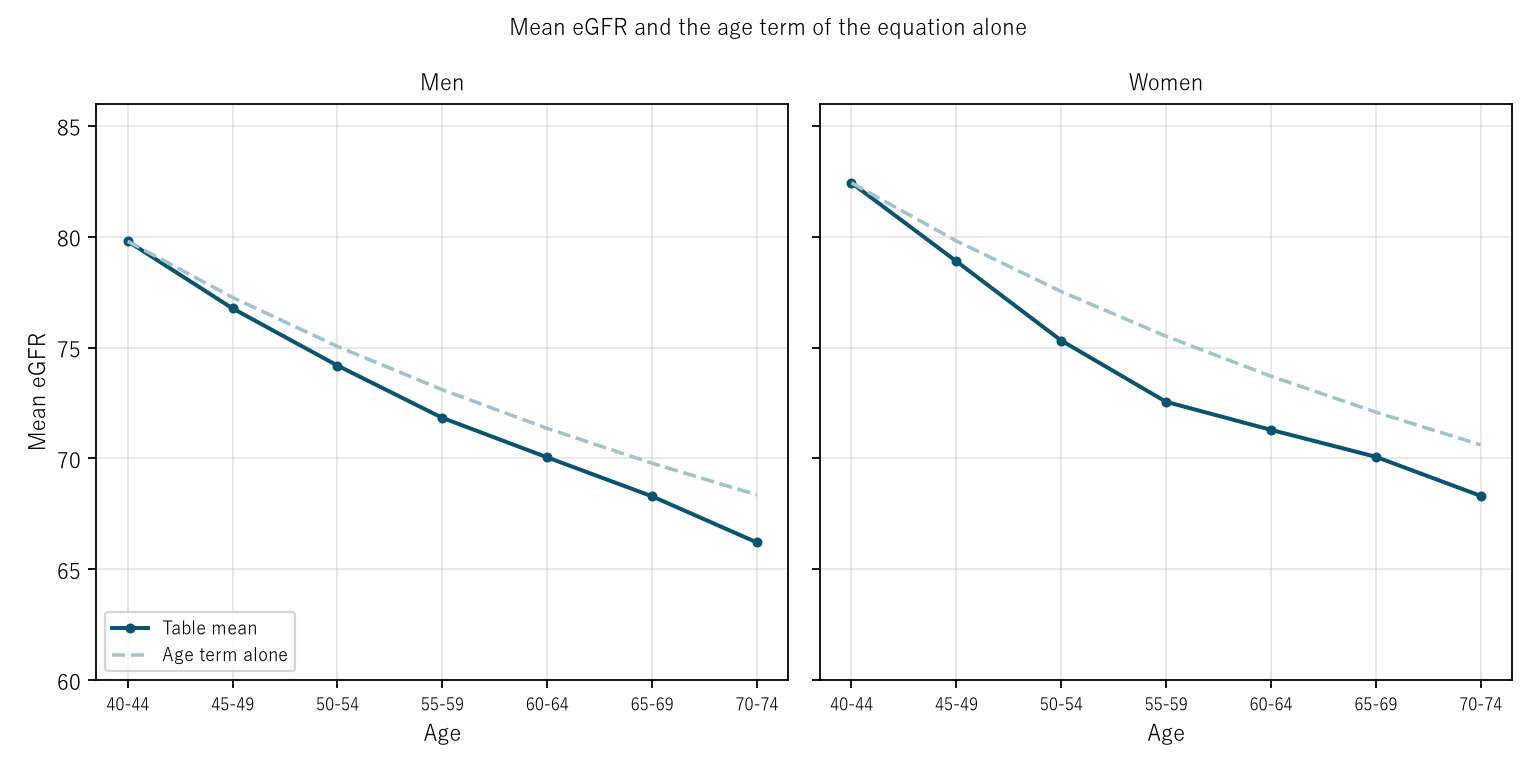
Figure 2: Mean eGFR (navy) and the prediction from the equation's age term alone (dashed). Most of the decline follows the dashed line.
6. Restating the same line in creatinine (men)
Calculation 6.1 Men: creatinine at eGFR 60 and the shares below (above) the two lines (%)
| Age | Creatinine at 60 | eGFR below 60 | Creatinine 1.0 or above |
|---|---|---|---|
| 40–44 | 1.097 | 3.60 | 13.21 |
| 45–49 | 1.065 | 6.80 | 15.14 |
| 50–54 | 1.037 | 11.09 | 17.26 |
| 55–59 | 1.012 | 16.15 | 19.37 |
| 60–64 | 0.990 | 21.32 | 20.67 |
| 65–69 | 0.970 | 26.25 | 22.17 |
| 70–74 | 0.952 | 32.73 | 24.78 |
Observation 6.2: The eGFR line of 60 is, in creatinine, a line that falls from 1.097 (age 42) to 0.952 (age 72). Counted with the table's creatinine band line of 1.0, men at 1.0 or above rise only 13.21 → 24.78% (1.88-fold). The two counts swap order between 55–59 and 60–64, the same place where the creatinine at eGFR 60 crosses 1.0 (1.012 at age 57, 0.990 at age 62). For women, the band line of 1.0 lies above the creatinine at eGFR 60 (0.722–0.832), so this comparison is not made.
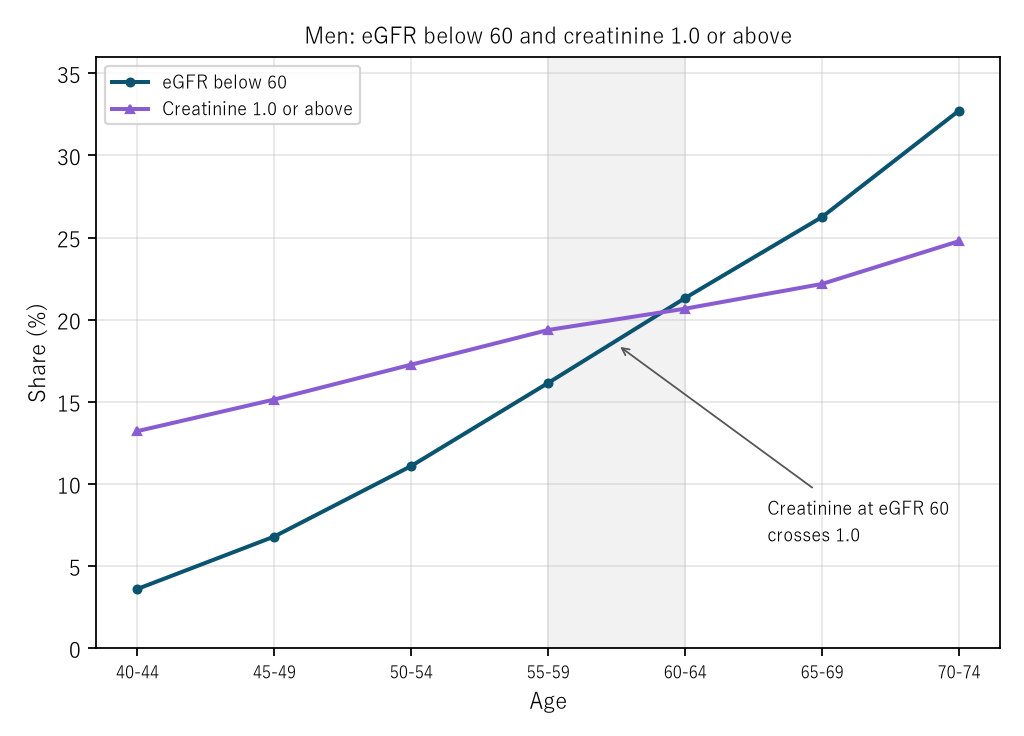
Figure 3: Men with eGFR below 60 (navy) and with creatinine 1.0 or above (purple). The order swaps in the grey band.
7. Combined with urine protein (CGA classification)
Calculation 7.1 Share in G3a–G5, share with urine protein (−) among them, and share with urine protein (+ or more) (%)
| Age | Men: G3a–G5 | Men: of which (−) | Men: protein (+ or more) | Women: G3a–G5 | Women: of which (−) | Women: protein (+ or more) |
|---|---|---|---|---|---|---|
| 40–44 | 3.54 | 79.2 | 2.76 | 2.54 | 85.1 | 1.98 |
| 45–49 | 6.69 | 80.7 | 3.13 | 5.09 | 87.3 | 2.01 |
| 50–54 | 11.00 | 81.2 | 3.61 | 9.42 | 89.5 | 1.72 |
| 55–59 | 16.05 | 82.0 | 3.98 | 13.97 | 91.1 | 1.43 |
| 60–64 | 21.22 | 81.8 | 4.64 | 17.46 | 91.4 | 1.66 |
| 65–69 | 26.17 | 80.1 | 5.76 | 20.83 | 89.4 | 2.36 |
| 70–74 | 32.66 | 77.1 | 7.52 | 26.76 | 86.3 | 3.61 |
Observation 7.2: Of people in G3a–G5, 77.1–91.4% have urine protein (−). The share with urine protein (+ or more) goes from 40–44 to 70–74 as 2.76 → 7.52% (2.73-fold) for men and 1.98 → 3.61% (1.82-fold) for women, not reaching a third of the fold change in G3a–G5 (men 9.24-fold, women 10.54-fold). For men it rises with age; for women it is lowest at 55–59 (1.43%).
8. Limitations
- People with eGFR are part of those who attended the Specific Health Checkups (0.446–0.901 of those with HbA1c). That part differs with age, and the shares are not those of the whole national population.
- The fit of the equation is checked between means. Whether the equation was used for each person cannot be seen from the tables. The ratio is 1.0234–1.0767, not exactly 1.
- Each 5-year age group is represented by its middle (with 42.5 and 72.5, the factor from the age term moves from 0.8567 to 0.8579).
- Only the creatinine band line of 1.0 is available, so the restatement comparison is made for men only.
- These are differences between ages in one fiscal year (2022), not the change in the same people as they age.
- It does not argue whether the line of 60 is good or whether the line should change with age. Prefectures are not compared. It is not one person's outlook.
Conclusion
In the 2022 Specific Health Checkups, people with eGFR below 60 increased 9.08-fold in men from 40–44 to 70–74. But the eGFR equation contains age, and 0.829 of the decline in mean eGFR was the equation's age term. The same line of 60 becomes, in measured creatinine, a line that falls from 1.097 to 0.952, and men with creatinine of 1.0 or above increase only 1.88-fold. Of people below the line, 77.1–91.4% had urine protein (−).
One thing separates them — whether the line is drawn on the measured value or on a value converted with age.
When you hear that "more people fall below the line with age," check together, from the side of the equation, whether age is already in that number.
Data and reproduction
| Data | 10th NDB Open Data (Ministry of Health, Labour and Welfare), Specific Health Checkups, "eGFR" (※1 and ※2), "serum creatinine," "CGA classification," "mean of each item," and "HbA1c," distribution by prefecture, sex, and age group (fiscal 2022, retrieved 26 September 2026); the PubMed record of Matsuo et al. (2009) |
| Terms of use | The Ministry of Health, Labour and Welfare pages follow the Public Data License (Version 1.0). This paper's shares, means, and conversions were produced by processing these and are not figures produced by the government |
| Scope | Japan (national figure from the 47 prefectures and the undetermined); attendees of the Specific Health Checkups aged 40–74 with eGFR; fiscal 2022 |
| Verification | 検算/M047.py (--zu also writes the figures). Every number in the text is taken from 検算/M047_output.txt |
| Raw data | The 8 retrieved files and SOURCES.md (URLs, retrieval dates, SHA-256, terms of use, definitions and calculation) in data/ |
| Figures | 図/M047_zu1 to 図/M047_zu3 (png, svg, English version) |
References
- Matsuo, S., Imai, E., Horio, M., et al. (2009). Revised Equations for Estimated GFR From Serum Creatinine in Japan. American Journal of Kidney Diseases, 53(6), 982–992. https://doi.org/10.1053/j.ajkd.2008.12.034
- Ministry of Health, Labour and Welfare. 10th NDB Open Data, Specific Health Checkups (eGFR, serum creatinine, CGA classification, mean of each item, and HbA1c distribution by prefecture, sex, and age group) (in Japanese) (accessed 26 September 2026). https://www.mhlw.go.jp/stf/seisakunitsuite/bunya/0000177221_00016.html
- Yamagishi, Y. (2026). The Share of "People with Hypertension" Moves 2.32-Fold with the Height of the Line and How Medication Is Counted — From 27.6% to 64.2% of Adults Aged 20+ in the 2023 Survey; Lowering the Line Adds More at Ages 20–49, Counting Medication Adds More at 70+ [M039]. Zenodo. https://doi.org/10.5281/zenodo.22974218
- Yamagishi, Y. (2026). The Mean HbA1c Rises Only 0.426 from Ages 40–44 to 70–74, Yet People at 6.5 or Above Increase 5.11-Fold — Shifting by the Mean Alone Predicts 6.67%, the Actual Is 16.34% (Men, Specific Health Checkups 2022), and People at 8.4 or Above Are Most Common at 55–59 [M046]. Zenodo. https://doi.org/10.5281/zenodo.22974590
Reference
Yamagishi, Y. (2026). People with eGFR Below 60 Increase 9.08-Fold in Men from Ages 40–44 to 70–74, but the Equation Contains Age [M047]. Zenodo.
DOI: 10.5281/zenodo.22974633
YOI: https://www.yamagishiyuuki.com/yoi/M047
ORCID: 0009-0006-8587-3450
PDF (English) · PDF (Japanese) · Date proof of the English PDF (OpenTimestamps .ots) · SHA256SUMS
The record page for this paper (in Japanese, with the PDFs in each language and the date proof): YOI M047. This paper is a preprint and has not been peer reviewed.