Abstract
For 10 rounds of the National Health and Nutrition Survey (2013–2019 and 2022–2024), the mean, median, and standard deviation of salt equivalent intake at ages 20 and over were lined up from Table 1-2 (men) and Table 1-3 (women) of each year. The paper checks whether the mean and median move alike, and whether the spread can be compared across years. It claims no new mathematical theorem and no new law.
First, the tables are consistent. The titles, columns, and rows of the 20 tables match the year and sex, and the table means, rounded, agree with the Ministry of Health, Labour and Welfare's summaries of results (2023: men 10.7 g, women 9.1 g; 2024: men 10.5 g, women 8.9 g). The note "national correction values" appears only in the 2016 and 2024 tables (Section 3).
Second, the mean and median always stand about the same distance apart. Mean − median stays within 0.39–0.57 for men and 0.31–0.47 for women, and the change from 2013 to 2023 is −0.48 in the mean and −0.48 in the median for men, and −0.32 and −0.29 for women. However, the ministry states, using age-adjusted values, that "over these 10 years, no significant increase or decrease is seen for either men or women" (Section 4).
Third, this is the core of the paper. Only in the 2024 table is the standard deviation of salt small. In the 8 years without national correction it is 3.98–4.16 for men and 3.43–3.67 for women, yet in 2024 it is 3.00 for men and 2.62 for women, 0.732 and 0.722 times the previous year (Section 5).
Fourth, it is not salt alone. Taking the ratio of the standard deviation over the 35 rows of the same table, the median for 2023→2024 is 0.748 for men and 0.746 for women, for 2015→2016 (the other national-correction year) 0.909 and 0.901, and for the control 2019→2022 0.999 and 0.958. The median ratio of the mean is 0.984–1.002 in every pair, so the mean does not move (Section 5).
Fifth, the numbers match the ratio of the sum of the national-correction weights. The weight is "the sum of the households surveyed in 2022 and 2023 ÷ the households surveyed in 2024," which overall gives (2,910 + 2,921) ÷ 10,414 = 0.5599, whose square root is 0.7483. This is close to the median ratio of the standard deviation for 2023→2024 (men's and women's rows together), 0.7469. But the formula for the standard deviation is not written in the summary, and the paper does not treat this agreement as a proof of the reason (Section 6).
Sixth, what separates them is whether what moved was on the side of people or on the side of how the table is made. The mean and median can be lined up across years, but the standard deviation of a national-correction year cannot be compared with other years on the same yardstick.
Scope note: This paper claims no new mathematical theorem and no new law — the means, medians, and standard deviations are in public tables; the paper only takes differences and ratios. This paper is a structural interpretation of the shape of numbers in published aggregate data, and is not medical advice, diagnosis, or a treatment recommendation. The author is not a physician. For decisions about individual health, consult a physician or medical institution. It is a preprint that has not been peer reviewed. It does not say that salt intake has fallen — in the ministry's test (on age-adjusted values), no significant increase or decrease is seen over the 10 years. It does not go into salt targets or effects on health. It does not assert why the 2024 standard deviation is small — it shows that the numbers match the ratio of the weight sum, but the formula is not in the summary. It does not say which year's standard deviation is "right." The version of the food composition table used for nutrient calculation could be confirmed only for 2018 and 2019 (the 2015 edition, seventh revision). The survey records the diet of one arbitrary day, not each person's usual intake. No age adjustment is made (the table's values for ages 20+ as they are). Prefectures are not compared. It is not one person's outlook. About the data: the National Health and Nutrition Survey (e-Stat) is used under the Public Data License (Version 2.0), and the ministry's reports and summaries under the Public Data License (Version 1.0); this paper's differences, ratios, and ranges were produced by processing them. What the paper adds: confirming with the 10 rounds of tables that the mean and median of salt move side by side across years, and that the standard deviation of national-correction years is small not only for salt, separating "change on the side of people" from "change in how the table is made."
1. Notation and question
- Salt equivalent: sodium (mg) × 2.54 ÷ 1,000 (a note in the tables from 2014 on). A value from the record of one arbitrary day's diet (g/day).
- Mean − median: the mean minus the median at ages 20+ for the same year and sex. A guide to the thickness of the right tail of the distribution.
- National correction values: values computed with weights that correct for differences in the number of households surveyed per prefecture (2024 summary). The 2016 and 2024 tables carry this note.
- Ratio of the standard deviation: for two adjacent years, the ratio of the standard deviation of the same row (nutrient) (later year ÷ earlier year).
Question: Do the mean and median of salt move alike? Can the spread (standard deviation) be compared across years?
Observation 1.1: M040 showed that the share of people with blood pressure of 140 or above is nearly determined by that year's mean, and that the largest drop in the mean coincides with the year the blood pressure device changed. M046 separated the shift of the mean of HbA1c from the change in the shape of its distribution. This paper separates, when a number moves, whether it moved on the side of people or on the side of how the table is made.
2. Survey and design
To be honest: the design was decided after seeing the tables.
| Content | |
|---|---|
| Tables | Table 1-2 (men) and Table 1-3 (women), "nutrient intake," of each year's National Health and Nutrition Survey, column "ages 20+ (restated)" |
| Years | 10 rounds: 2013–2019 and 2022–2024 (the 2020 and 2021 surveys were cancelled) |
| Reports | The 2018 and 2019 reports (version of the food composition table) and the 2022, 2023, and 2024 summaries (households, national correction, test) |
| Yardsticks | Mean − median, standard deviation, and the ratios of the standard deviation and of the mean over 35 rows |
| Expected and measured | I expected the mean and median to move in the same direction in all 9 changes between adjacent surveys. Measured: 8 for men and 7 for women. I expected the control 2019→2022 ratio of the standard deviation to be 0.97–1.03, but for women it was 0.958 |
| Noticed while surveying | Only the 2024 standard deviation of salt was far smaller than other years. So the other nutrients in the same table were compared too |
3. Data and checks
Calculation 3.1 The 25 retrieved files (20 tables and 5 reports and summaries) were fixed by SHA-256, and the following was checked.
- The titles of the 20 tables match the year (2013 to 2024) and Table 1-2 (men) / Table 1-3 (women), and every table has exactly one "ages 20+ (restated)" column and one "salt equivalent" row in g.
- The note on national correction values (the mean, standard deviation, and median are national correction values) appears only in the 2016 and 2024 tables.
- The table means, rounded, agree with the summaries (2023: men 10.7, women 9.1; 2024: men 10.5, women 8.9).
- The 2018 and 2019 reports state that the "Standard Tables of Food Composition in Japan 2015 (Seventh Revised Edition)" was used to calculate nutrient intake. The text of other years' reports could not be extracted in this environment and was not checked.
- The 2023 summary states that the 2020 and 2021 surveys were cancelled, and that the test of the trend over years uses values age-adjusted to the 2010 census standard population.
- The dietary survey was on "one arbitrary day excluding Sundays and public holidays" in both 2023 and 2024.
- Households surveyed: 2,910 in 2022, 2,921 in 2023, and 10,414 in 2024.
4. Mean and median
Calculation 4.1 Salt equivalent at ages 20+ (g/day)
| Year | Men: mean | Men: median | Men: mean − median | Women: mean | Women: median | Women: mean − median |
|---|---|---|---|---|---|---|
| 2013 | 11.13 | 10.70 | 0.43 | 9.37 | 8.98 | 0.39 |
| 2014 | 10.89 | 10.36 | 0.54 | 9.19 | 8.83 | 0.37 |
| 2015 | 10.98 | 10.54 | 0.43 | 9.17 | 8.79 | 0.38 |
| 2016 | 10.80 | 10.23 | 0.57 | 9.17 | 8.75 | 0.42 |
| 2017 | 10.78 | 10.29 | 0.49 | 9.08 | 8.64 | 0.44 |
| 2018 | 11.00 | 10.53 | 0.47 | 9.34 | 8.87 | 0.47 |
| 2019 | 10.94 | 10.51 | 0.43 | 9.27 | 8.96 | 0.31 |
| 2022 | 10.53 | 10.11 | 0.42 | 8.95 | 8.54 | 0.41 |
| 2023 | 10.65 | 10.22 | 0.43 | 9.05 | 8.69 | 0.36 |
| 2024 | 10.51 | 10.12 | 0.39 | 8.90 | 8.49 | 0.41 |
Observation 4.2: In every year the mean lies above the median, and mean − median stays within 0.39–0.57 for men and 0.31–0.47 for women. The change from 2013 to 2023 is −0.48 in the mean and −0.48 in the median for men, and −0.32 and −0.29 for women, almost the same (to 2024: men −0.62 and −0.58, women −0.47 and −0.49). The direction of change between adjacent surveys agrees in 8 of 9 for men and 7 for women. However, the ministry states, using age-adjusted values, that "over these 10 years, no significant increase or decrease is seen for either men or women." This paper does not say that intake fell.
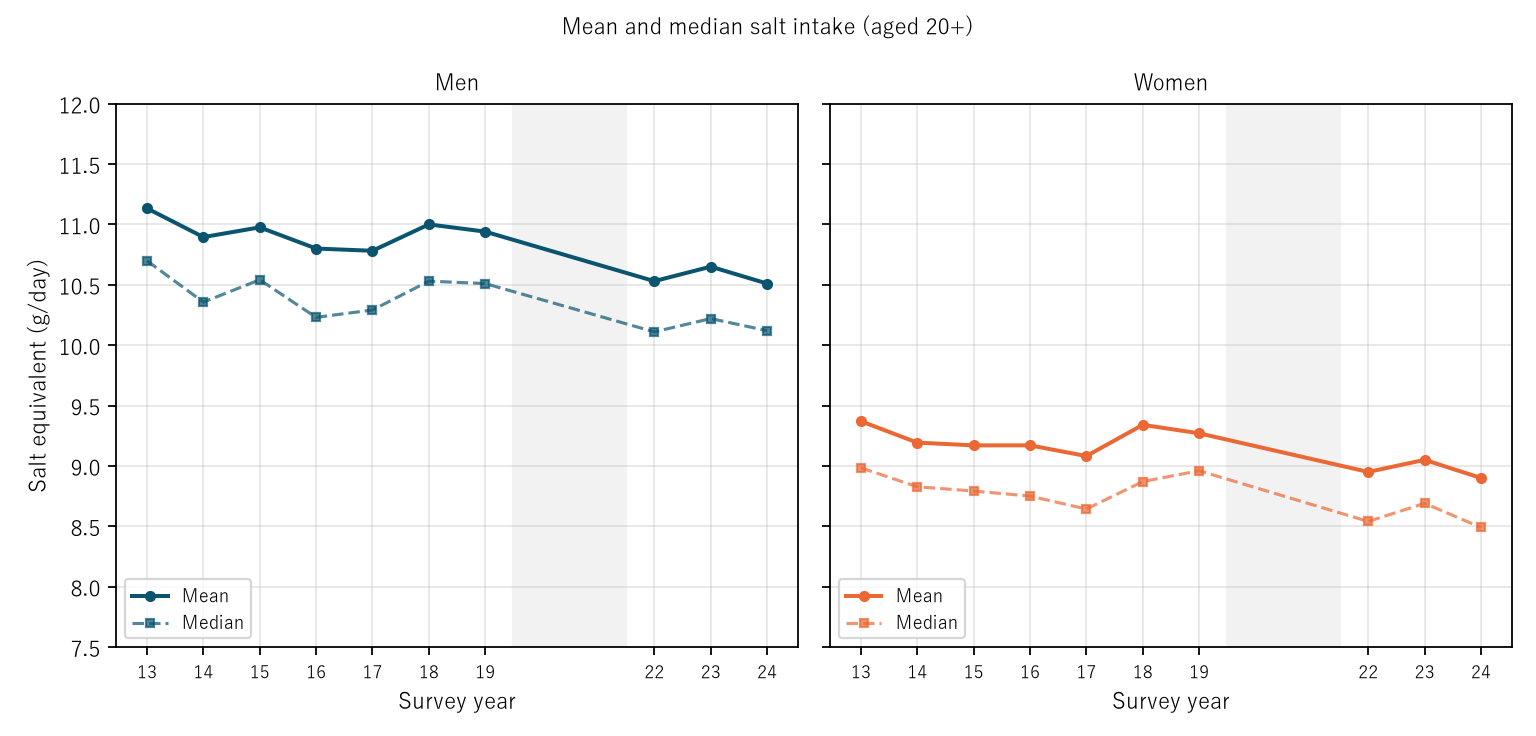
Figure 1: Mean (solid) and median (dashed) salt equivalent at ages 20+. The horizontal axis shows the last two digits of the survey year. Grey marks the cancelled years 2020 and 2021.
5. Core — only the spread is small in national-correction years
Calculation 5.1 Standard deviation of salt (g/day) and number surveyed
| Year | Men: SD | Men: surveyed | Women: SD | Women: surveyed |
|---|---|---|---|---|
| 2013 | 4.16 | 2,998 | 3.67 | 3,483 |
| 2014 | 4.10 | 3,112 | 3.46 | 3,615 |
| 2015 | 4.15 | 2,840 | 3.54 | 3,332 |
| 2016 (national correction) | 3.84 | 9,987 | 3.25 | 11,864 |
| 2017 | 3.98 | 2,714 | 3.47 | 3,080 |
| 2018 | 4.03 | 2,663 | 3.51 | 3,080 |
| 2019 | 4.13 | 2,297 | 3.58 | 2,630 |
| 2022 | 4.04 | 2,059 | 3.43 | 2,394 |
| 2023 | 4.10 | 2,097 | 3.63 | 2,375 |
| 2024 (national correction) | 3.00 | 7,225 | 2.62 | 8,491 |
Calculation 5.2 Median of the ratios over the 35 rows (nutrients) of the same table
| Pair of years | Men: ratio of SD | Men: ratio of mean | Women: ratio of SD | Women: ratio of mean |
|---|---|---|---|---|
| 2015 → 2016 | 0.909 | 0.984 | 0.901 | 0.996 |
| 2023 → 2024 | 0.748 | 1.002 | 0.746 | 0.995 |
| 2019 → 2022 | 0.999 | 0.988 | 0.958 | 0.989 |
Observation 5.3: In the 8 years without national correction, the standard deviation of salt is 3.98–4.16 for men and 3.43–3.67 for women, yet in 2024 it is 3.00 for men and 2.62 for women (0.732 and 0.722 times 2023). The same happens in almost all 35 rows — for 2023→2024, the ratio of the standard deviation is below 0.9 in 33 rows for men and 34 for women, and its median is 0.748 for men and 0.746 for women. In 2016, the other national-correction year, it is 0.909 and 0.901, and in the control 2019→2022 (neither a national-correction year) it is 0.999 and 0.958. Meanwhile the median ratio of the mean is 0.984–1.002 in every pair and does not move. Eating did not suddenly become uniform in one year; in years when the table is made differently, only the number for the spread comes out smaller.
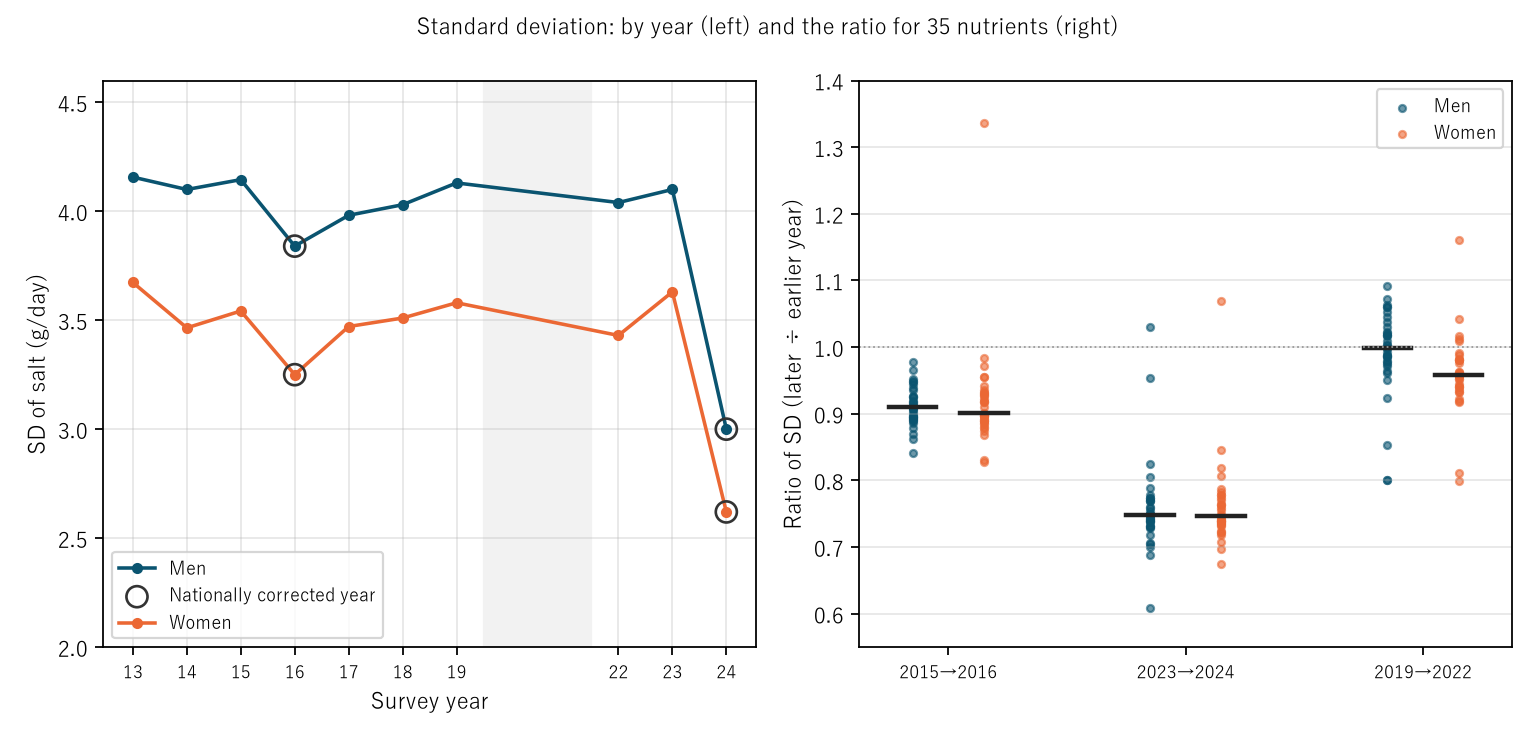
Figure 2: Left, the standard deviation of salt (circled points are national-correction years). Right, the ratio of the standard deviation over 35 rows (dots) and its median (bars).
6. The numbers match the ratio of the weight sum
Calculation 6.1 According to the 2024 summary, the national correction values were computed with weights equal to "the sum of the households surveyed in each prefecture in the latest two years (2022 and 2023) divided by the households surveyed in 2024," giving the mean, standard deviation, and median. Averaged over the whole, the ratio of the weight sum is (2,910 + 2,921) ÷ 10,414 = 0.5599, whose square root is 0.7483.
Observation 6.2: This 0.7483 is close to the median ratio of the standard deviation for 2023→2024, 0.7469 (men's and women's rows together). If the standard deviation were computed by dividing by the number of people rather than by the sum of the weights, it would come out smaller by exactly this square root — the numbers are consistent with that explanation (in synthetic data with an average weight of 0.5597, the ratio is 0.7481). But the summary does not give the formula for the standard deviation, and the 2016 weights were not checked. The paper only places this as one candidate reason and does not treat it as a proof. If the weights are divided back out, the mean and median do not move with the size of the weights, so the comparison in Section 4 is considered unaffected.
7. Limitations
- The version of the food composition table could be confirmed only for 2018 and 2019. A change of version can change the numbers even for the same diet.
- One arbitrary day's diet, not each person's usual intake.
- No age adjustment (the table's values for ages 20+ as they are). The ministry's test uses age-adjusted values and reports no significant increase or decrease.
- The formula for the national-correction standard deviation was not checked (the paper only shows that the numbers match the ratio of the weight sum).
- The number surveyed differs by year (men 2,059–9,987). It does not go into salt targets or effects on health. Prefectures are not compared. It is not one person's outlook.
Conclusion
Across 10 rounds of the National Health and Nutrition Survey, the mean and median of salt at ages 20+ always stood 0.39–0.57 g apart for men and 0.31–0.47 g for women, and moved by about the same amount. Yet only in the 2024 table was the standard deviation 0.732 times the previous year (men), and across the 35 nutrients of the same table the median ratio of the standard deviation was 0.748 while that of the mean was 1.002.
One thing separates them — whether what moved was on the side of people or on the side of how the table is made.
When the spread appears to have "become smaller" across years, check together whether that year's table carries a note that it was made differently from other years.
Data and reproduction
| Data | National Health and Nutrition Survey (Ministry of Health, Labour and Welfare, e-Stat), Tables 1-2 and 1-3 for 2013–2019 and 2022–2024; the ministry's reports (survey outlines for 2018 and 2019) and summaries of results (2022, 2023, 2024) (retrieved 26 September 2026) |
| Terms of use | e-Stat follows the Public Data License (Version 2.0), and the ministry's pages follow the Public Data License (Version 1.0). This paper's differences, ratios, and ranges were produced by processing these and are not figures produced by the government |
| Scope | Japan; ages 20+; 2013–2019 and 2022–2024 |
| Verification | 検算/M048.py (--zu also writes the figures). Every number in the text is taken from 検算/M048_output.txt |
| Raw data | The 25 retrieved files and SOURCES.md (URLs, retrieval dates, SHA-256, terms of use, definitions and calculation) in data/ |
| Figures | 図/M048_zu1 and 図/M048_zu2 (png, svg, English version) |
References
- Ministry of Health, Labour and Welfare. National Health and Nutrition Survey 2013–2019 and 2022–2024, Tables 1-2 and 1-3 (in Japanese). e-Stat (accessed 26 September 2026). https://www.e-stat.go.jp/
- Ministry of Health, Labour and Welfare. National Health and Nutrition Survey Report 2018, Survey Outline (in Japanese) (accessed 26 September 2026). https://www.mhlw.go.jp/content/001741046.pdf
- Ministry of Health, Labour and Welfare. National Health and Nutrition Survey Report 2019, Survey Outline (in Japanese) (accessed 26 September 2026). https://www.mhlw.go.jp/content/001066904.pdf
- Ministry of Health, Labour and Welfare. On the Summary of Results of the 2022 National Health and Nutrition Survey (in Japanese) (accessed 26 September 2026). https://www.mhlw.go.jp/content/10901000/001325269.pdf
- Ministry of Health, Labour and Welfare. Summary of Results of the 2023 National Health and Nutrition Survey (in Japanese) (accessed 26 September 2026). https://www.mhlw.go.jp/content/10900000/001338334.pdf
- Ministry of Health, Labour and Welfare. Summary of Results of the 2024 National Health and Nutrition Survey (in Japanese) (accessed 26 September 2026). https://www.mhlw.go.jp/content/10900000/001603146.pdf
- Yamagishi, Y. (2026). The Share of People with Systolic Blood Pressure of 140 or Above Is Nearly Determined by That Year's Mean — Across 8 Surveys from 2013 to 2023 at Ages 50+, the Share Fitted from the Mean Alone Misses by a Spread of 1.76 Points, and the Largest Drop in the Mean Falls in 2018→2019, the Year the Device Changed, in 4 of 6 Cells [M040]. Zenodo. https://doi.org/10.5281/zenodo.22974334
- Yamagishi, Y. (2026). The Mean HbA1c Rises Only 0.426 from Ages 40–44 to 70–74, Yet People at 6.5 or Above Increase 5.11-Fold — Shifting by the Mean Alone Predicts 6.67%, the Actual Is 16.34% (Men, Specific Health Checkups 2022), and People at 8.4 or Above Are Most Common at 55–59 [M046]. Zenodo. https://doi.org/10.5281/zenodo.22974590
Reference
Yamagishi, Y. (2026). The Mean and Median of Salt Intake Move Side by Side, Always 0.31–0.57 g Apart, Across 10 Surveys, Yet Only in the 2024 Table Is the Standard Deviation 0.732 Times the Previous Year [M048]. Zenodo.
DOI: 10.5281/zenodo.22974707
YOI: https://www.yamagishiyuuki.com/yoi/M048
ORCID: 0009-0006-8587-3450
PDF (English) · PDF (Japanese) · Date proof of the English PDF (OpenTimestamps .ots) · SHA256SUMS
The record page for this paper (in Japanese, with the PDFs in each language and the date proof): YOI M048. This paper is a preprint and has not been peer reviewed.