Abstract
Using the condensed cause-of-death list of the Vital Statistics (2024, final figures), deaths related to the liver were divided into three chapters — "liver disease" (chapter of diseases of the digestive system), "viral hepatitis" (chapter of infectious diseases), and "malignant neoplasms of liver and intrahepatic bile ducts" (chapter of neoplasms; "liver cancer" in this paper) — and the age shape and men-to-women ratio were lined up for each content. It claims no new mathematical theorem and no new law.
First, the tables are consistent. Liver disease = cirrhosis (excluding alcoholic) + other liver disease, and viral hepatitis = type B + type C + other, hold for totals, by age, and by sex, and every cause satisfies total = men + women (Section 3).
Second, the "liver disease" chapter holds only 0.441 of the 42,771 deaths in the three liver-related chapters combined. Liver cancer has 22,465 (0.525) and viral hepatitis 1,448 (0.034); the number changes more than 2-fold depending on which is called "deaths from liver disease" (Section 4).
Third, this is the core of the paper. The age shape differs clearly by content. The share of men's deaths under 65 is 0.411 for other liver disease, 0.286 for cirrhosis (excluding alcoholic), 0.183 for viral hepatitis, and 0.098 for liver cancer. The middle age group of deaths is 65–69 for other liver disease, 70–74 for cirrhosis, and 75–79 for liver cancer and viral hepatitis. For men aged 30–64, "other liver disease" has the highest death rate of the four (Section 5).
Fourth, the men-to-women ratio also differs by content and age. Men ÷ women in deaths is 2.84 for other liver disease, 2.06 for liver cancer, 1.20 for cirrhosis (excluding alcoholic), and 0.91 for viral hepatitis (type C is 0.78, more common in women). The men-to-women ratio of death rates for liver disease is largest at 4.19 at ages 55–59 and comes down to 1.48 at 90–94. For other liver disease it is largest at 6.16 at 65–69 (Section 6).
Fifth, even within "liver disease," the men-to-women ratio at 85–89 is a small 1.20 for cirrhosis (excluding alcoholic) and a large 2.53 for other liver disease. The chapter name and the content names bundle different shapes into one (Section 6).
Sixth, what separates them is which chapter, and which contents, are counted. "People who die of liver disease" changes in number, in the age peak, and in the men-to-women ratio depending on the box used to count them.
Scope note: This paper claims no new mathematical theorem and no new law — the death counts and death rates are in public tables, and this paper only lined them up by cause-of-death category and compared them. This paper is a structural interpretation of the shape of numbers in public aggregate data; it is not medical advice, not a diagnosis, and not a treatment recommendation. The author is not a physician. Decisions about individual health should be discussed with a physician or a medical institution. This is a preprint that has not been peer reviewed. It does not go into the relation to drinking or infection. What "other liver disease" contains is handled by the name in the table; its breakdown was not checked. The cause of death is the underlying cause based on death certificates, and this does not blame those who wrote them. It is a comparison of age differences in one year (2024), not how the same people change. The men-to-women ratio of death rates was looked at only for ages where both sexes have 20 or more deaths. Prefectures are not compared. It is not a forecast for any individual. About the data: the Vital Statistics (e-Stat) are used under the Government Standard Terms of Use (Version 2.0), and the shares and ratios in this paper were created by processing them. What this paper adds: dividing liver-related deaths into three chapters and five contents, and showing in one year's tables that the "liver disease" chapter does not reach half, and that the age peak and men-to-women ratio differ by content.
1. Notation and question
- Three chapters: "liver disease" (11300, chapter of diseases of the digestive system), "viral hepatitis" (01400, chapter of certain infectious and parasitic diseases), and "malignant neoplasms of liver and intrahepatic bile ducts" (02106, chapter of neoplasms). The last is called "liver cancer" in this paper.
- Contents of liver disease: 11301 cirrhosis (excluding alcoholic) and 11302 other liver disease.
- Share under 65: the share of deaths at ages 0–64 (excluding unknown age).
- Middle age group of deaths: adding deaths from the youngest age up, the 5-year group where the sum passes half.
- Men-to-women ratio of death rates: in the same 5-year group, men's death rate ÷ women's death rate (groups where both sexes have 20 or more deaths).
Question: How do the number, the age peak, and the men-to-women ratio of "people who die of liver disease" change with the box used to count them?
Observation 1.1: M038 showed that the effect of the age composition differs by content within "heart disease." M045 showed that the number of "people with diabetes" changes by orders of magnitude with what is counted. This paper looks at how the shape changes with which box of the cause-of-death classification liver-related deaths fall into.
2. Survey and design
To be honest: the design was decided after seeing the tables.
| Content | |
|---|---|
| Tables | Vital Statistics 2024 (final figures), Volume 2 Table 2 (deaths by condensed cause, sex, 5-year age) and Volume 1 Table 5.16 (death rates) |
| Noticed in the survey | Liver-related deaths were split not only into "liver disease" but also into viral hepatitis in the chapter of infectious diseases and liver cancer in the chapter of neoplasms |
| Measures | Death counts and men-to-women ratio, share under 65, middle age group of deaths, men-to-women ratio of death rates by age |
| Expectation and measurement | The share under 65 for "other liver disease" was expected to be more than 2 times that of cirrhosis (excluding alcoholic) in both sexes, but for men it was 1.44 times (2.70 times for women) |
3. Data and checks
Calculation 3.1 The 2 retrieved files were fixed by SHA-256, and the following was checked.
- The death-count table is "Volume 2, Deaths, Table 2: deaths by cause (condensed list), sex, and age (5-year groups)," and the death-rate table is "Volume 1, Deaths, Table 5.16 … death rates (per 100,000 population)." Both have the 21 five-year groups from 0–4 to 100+.
- The chapter rows are "01000 certain infectious and parasitic diseases," "02000 neoplasms," and "11000 diseases of the digestive system." The rows for the 8 causes are present in both tables for men, women, and total.
- Liver disease = cirrhosis (excluding alcoholic) + other liver disease, and viral hepatitis = type B + type C + other, hold for totals, by age, and by sex. For every cause, total = men + women, and the sum of 5-year groups + unknown = total.
4. Death counts in the three chapters
Calculation 4.1 Liver-related deaths (2024)
| Cause | Deaths | Men | Women | Men ÷ Women |
|---|---|---|---|---|
| Liver disease | 18,858 | 12,285 | 6,573 | 1.87 |
| of which: cirrhosis (excl. alcoholic) | 8,515 | 4,636 | 3,879 | 1.20 |
| of which: other liver disease | 10,343 | 7,649 | 2,694 | 2.84 |
| Viral hepatitis | 1,448 | 688 | 760 | 0.91 |
| of which: type B | 317 | 172 | 145 | 1.19 |
| of which: type C | 948 | 414 | 534 | 0.78 |
| Liver cancer (liver and intrahepatic bile ducts) | 22,465 | 15,133 | 7,332 | 2.06 |
Observation 4.2: The three chapters sum to 42,771, of which the "liver disease" chapter is 0.441, liver cancer 0.525, and viral hepatitis 0.034. Saying "people who died of liver disease" does not reach even half of liver-related deaths. Viral hepatitis has men ÷ women 0.91, and type C is 0.78, more common in women.
5. Core — the age peak differs by content
Calculation 5.1 Share under 65 and middle age group of deaths
| Cause | Men: under 65 | Men: middle | Women: under 65 | Women: middle |
|---|---|---|---|---|
| Cirrhosis (excl. alcoholic) | 0.286 | 70–74 | 0.113 | 80–84 |
| Other liver disease | 0.411 | 65–69 | 0.305 | 75–79 |
| Viral hepatitis | 0.183 | 75–79 | 0.038 | 85–89 |
| Liver cancer | 0.098 | 75–79 | 0.049 | 80–84 |
| Liver disease (total) | 0.364 | 70–74 | 0.192 | 80–84 |
Observation 5.2: For men, the share under 65 is largest for other liver disease at 0.411, followed by cirrhosis (excluding alcoholic) 0.286, viral hepatitis 0.183, and liver cancer 0.098. For women too, other liver disease is 0.305 against cirrhosis (excluding alcoholic) 0.113, liver cancer 0.049, and viral hepatitis 0.038. For men from 30–34 to 60–64, "other liver disease" has the highest death rate of the four, and at 65–69 liver cancer exceeds it.
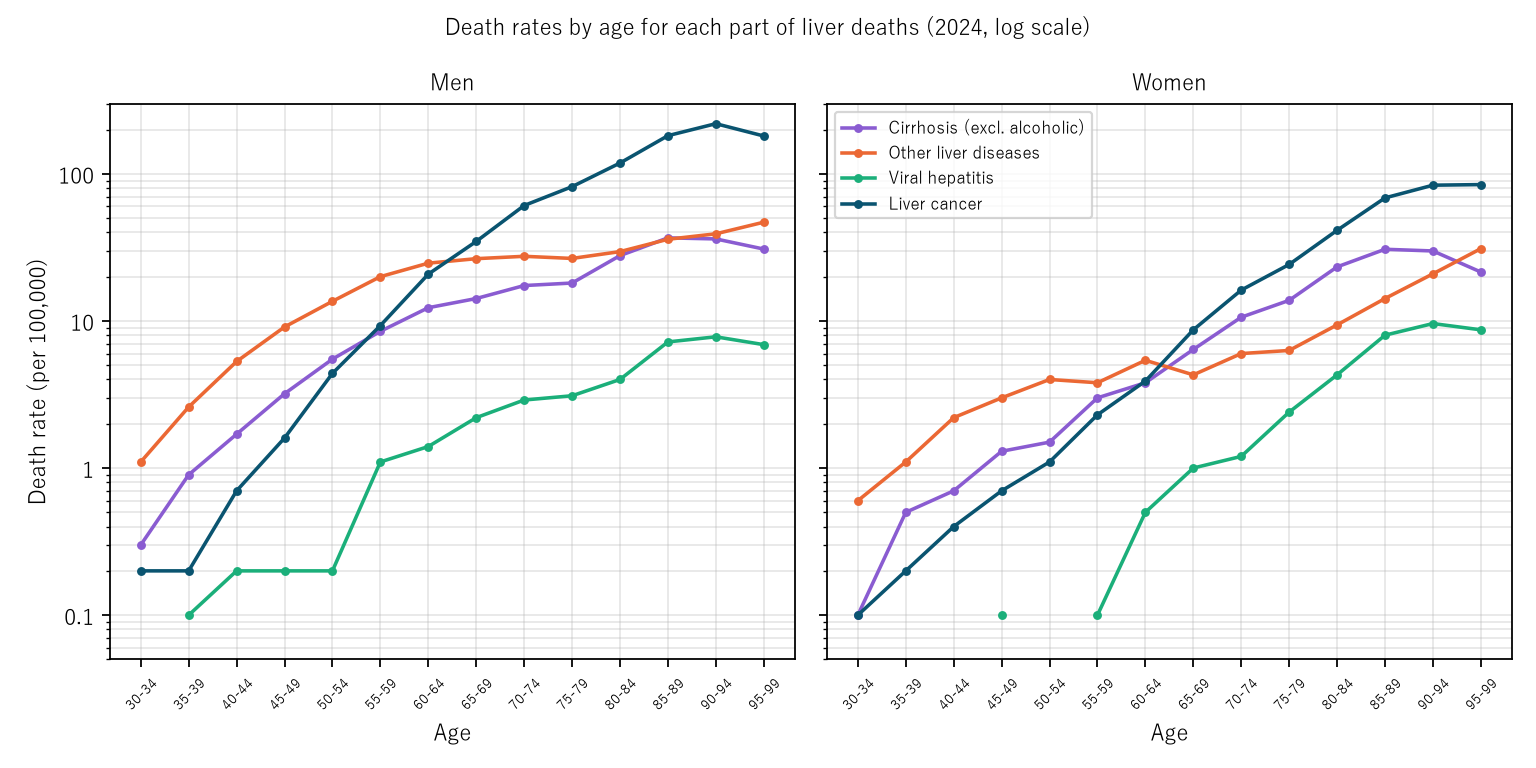
Figure 1: Death rates by age for each content in 2024 (per 100,000; vertical axis logarithmic). Purple is cirrhosis (excluding alcoholic), orange other liver disease, green viral hepatitis, and navy liver cancer.
6. The men-to-women ratio differs by content and age
Calculation 6.1 Men-to-women ratio of death rates (men ÷ women; ages where both sexes have 20 or more deaths)
| Age | Liver disease | Cirrhosis (excl. alcoholic) | Other liver disease | Liver cancer |
|---|---|---|---|---|
| 30–34 | 2.00 | — | — | — |
| 35–39 | 2.19 | — | 2.36 | — |
| 40–44 | 2.50 | 2.43 | 2.41 | — |
| 45–49 | 2.86 | 2.46 | 3.03 | 2.29 |
| 50–54 | 3.47 | 3.67 | 3.40 | 4.00 |
| 55–59 | 4.19 | 2.83 | 5.26 | 4.04 |
| 60–64 | 4.02 | 3.24 | 4.57 | 5.33 |
| 65–69 | 3.84 | 2.22 | 6.16 | 3.99 |
| 70–74 | 2.70 | 1.64 | 4.58 | 3.76 |
| 75–79 | 2.22 | 1.31 | 4.22 | 3.38 |
| 80–84 | 1.76 | 1.19 | 3.15 | 2.87 |
| 85–89 | 1.62 | 1.20 | 2.53 | 2.65 |
| 90–94 | 1.48 | 1.21 | 1.87 | 2.62 |
| 95–99 | 1.48 | 1.43 | 1.51 | 2.14 |
Observation 6.2: The men-to-women ratio of death rates for liver disease rises from 2.00 at 30–34 to its largest, 4.19, at 55–59, and comes down to 1.48 at 90–94. Divided by content, other liver disease is largest at 6.16 at 65–69 and still 2.53 at 85–89, while cirrhosis (excluding alcoholic) is a small 1.20 at 85–89. Liver cancer is largest at 5.33 at 60–64. The single men-to-women ratio of "liver disease" is a value that bundles two contents of different shapes.
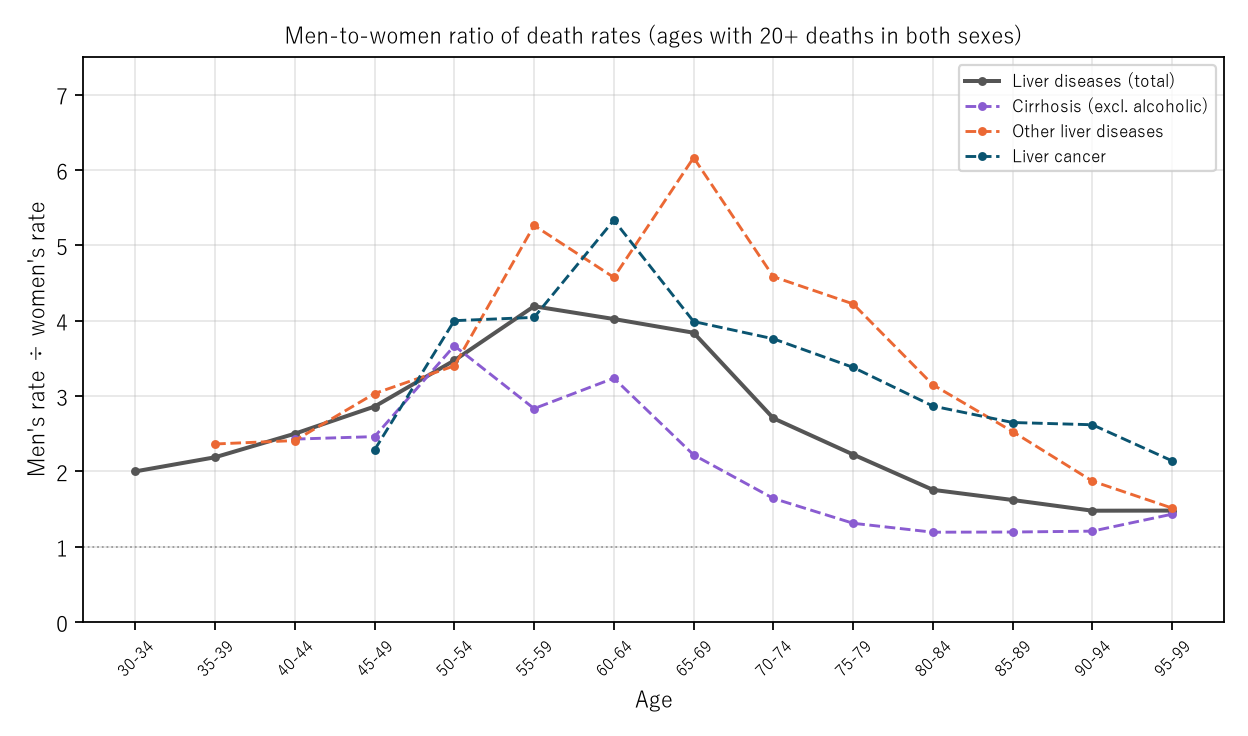
Figure 2: Men-to-women ratio of death rates by age (ages where both sexes have 20 or more deaths). The gray solid line is liver disease (total), and the dashed lines are the contents and liver cancer (colors as in Figure 1). The horizontal line at 1 is where men and women are equal.
7. Limitations
- A comparison of age differences in one year (2024), not how the same people change. Trends over years were not looked at.
- What "other liver disease" contains was handled by the name in the table (its breakdown was not checked).
- The cause of death is the underlying cause based on death certificates, and which chapter it falls into follows the classification rules. This does not blame those who wrote them.
- The men-to-women ratio of death rates was looked at only for ages where both sexes have 20 or more deaths.
- It does not go into the relation to drinking or infection. Prefectures are not compared. It is not a forecast for any individual.
Conclusion
In the 2024 Vital Statistics, liver-related deaths fell into three chapters, and the "liver disease" chapter held only 0.441 of the 42,771. By content, the share of men's deaths under 65 ranged from 0.098 to 0.411, and the men-to-women ratio of death rates for liver disease moved from 4.19 at 55–59 to 1.48 at 90–94. Type C viral hepatitis was more common in women.
One thing separates them — which chapter, and which contents, are counted.
On hearing "people who die of liver disease," check together which chapter and which contents were counted, and whether the shape is the same by age and sex.
Data and reproduction
| Data | Vital Statistics 2024 (final figures) (Ministry of Health, Labour and Welfare; e-Stat), Volume 2 Table 2 and Volume 1 Table 5.16 (retrieved 26 September 2026) |
| Terms of use | e-Stat follows the Government Standard Terms of Use (Version 2.0). The shares and ratios in this paper were created by processing it and are not figures produced by the government |
| Scope | Japan, 2024 |
| Checker | 検算/M054.py (--zu also draws the figures). Every number in the text is taken from 検算/M054_output.txt |
| Raw data | The 2 retrieved files and SOURCES.md in data/ (URLs, retrieval date, SHA-256, terms of use, definitions and how calculations are set up) |
| Figures | 図/M054_zu1, 図/M054_zu2 (png, svg, English versions) |
References
- Ministry of Health, Labour and Welfare. Vital Statistics 2024 (final figures), Volume 2 Table 2 and Volume 1 Table 5.16 (in Japanese). e-Stat (accessed 26 September 2026). https://www.e-stat.go.jp/
- Yamagishi, Y. (2026). Heart Failure Deaths Rose Because of the Age Composition, While Its Share of Heart Disease Rose Because Acute Myocardial Infarction Fell Faster — For Men from 1995 to 2020, Heart Failure's Crude Death Rate Rose 2.070-Fold and Its Age-Standardized Rate Fell to 0.844, While Acute Myocardial Infarction's Age-Standardized Rate Fell to 0.279 [M038]. Zenodo. https://doi.org/10.5281/zenodo.22974029
- Yamagishi, Y. (2026). The Number of "People with Diabetes" Changes by Orders of Magnitude with What Is Counted — Per 100,000 at 70+, 19,500 Strongly Suspected by Test, 12,130 Visiting a Clinic, 449–1,948 in Care on the Survey Day, and 44.8 Deaths a Year; the Rise from 40–49 Also Ranges from 3.1-Fold to 29.4-Fold [M045]. Zenodo. https://doi.org/10.5281/zenodo.22974556
Reference
Yamagishi, Y. (2026). Liver Deaths Fall into Three Chapters of the Cause-of-Death List, and the "Liver Disease" Chapter Holds Only 0.441 of the 42,771 in 2024 [M054]. Zenodo.
DOI: 10.5281/zenodo.22975206
YOI: https://www.yamagishiyuuki.com/yoi/M054
ORCID: 0009-0006-8587-3450
PDF (English) · PDF (Japanese) · Date proof of the English PDF (OpenTimestamps .ots) · SHA256SUMS
The record page for this paper (in Japanese, with the PDFs in each language and the date proof): YOI M054. This paper is a preprint and has not been peer reviewed.