Abstract
Using the cause-of-death list for trends in the Vital Statistics (1950–2024, 5-year age groups), the rise in deaths from senility ("old age") was divided into three parts and lined up: the age composition of the population, the age-specific rates, and the swapping of causes within the same age. It claims no new mathematical theorem and no new law.
First, the tables are consistent. For every cause and year, total = men + women and the sum of 5-year groups + unknown = total, and the population back-calculated from the senility sheet agrees with that from the all-cause sheet to within a relative 0.001 (Section 3).
Second, deaths from senility fell from 58,412 in 1950 to 21,213 in 2000, and were 206,887 in 2024. Of the 7.85-fold rise from 2005 to 2024 (excluding unknown age), keeping the rates at 2005 and moving only the age composition to 2024 gives 2.51-fold, and keeping the population at 2005 and moving only the age-specific rates to 2024 gives 3.25-fold. Within the same classification, 2005 to 2016, the rate part (1.98-fold) is also larger than the age-composition part (1.80-fold) (Section 4).
Third, the age-specific rates traced a U shape. The senility rate at 85–89 (per 100,000) fell from 10813.0 in 1950 to 290.3 in 2005, to 1/37.2, and came back to 1043.5 in 2024 (3.59 times 2005). At both 80–84 and 85–89, and for both men and women, 2005 is the lowest (Section 5).
Fourth, this is the core of the paper. From 2005 to 2024, at every 5-year age group 80+, the senility rate rose 2.66–4.36-fold, while the sum of the rates of pneumonia, heart disease (excluding hypertensive), and cerebrovascular disease fell to 0.50–0.59. The all-cause rate moved 0.85–1.26-fold, overlapping neither range. The share of senility in all deaths at ages 100+ went from 0.226 to 0.478 (Section 6).
Fifth, the rise in the senility rate ÷ the fall in the sum of the three rates grows with age, from 0.21 at 80–84 to 0.99 at 95–99 and 1.83 at 100+. At 95–99, the rise and the fall are almost the same size. In 2005 to 2016, under the same classification, the order is the same (0.11 to 1.49) (Section 7).
Sixth, what separates them is the age composition of the population, the age-specific rates, or the swapping of causes within the same age. The rise in senility contains all three, and cannot be stated by any one of them alone.
Scope note: This paper claims no new mathematical theorem and no new law — the death counts and death rates are in public tables, and the method of dividing into age composition and rates is long established. This paper applied it to senility and lined up the results. This paper is a structural interpretation of the shape of numbers in public aggregate data; it is not medical advice, not a diagnosis, and not a treatment recommendation. The author is not a physician. Decisions about individual health should be discussed with a physician or a medical institution. This is a preprint that has not been peer reviewed. It does not discuss whether the diagnosis of "senility" is right or wrong. The cause of death is the underlying cause based on death certificates, and this does not blame those who wrote them. Whether the pattern of the senility rate rising and other causes' rates falling within the same age is a change in how certificates are written or a change in how people actually die cannot be separated by these aggregate numbers. Considering that families who cared for someone at the end of life may read it, it is not written as an outlook for any one person's death. About the data: the Vital Statistics (e-Stat) are used under the Government Standard Terms of Use (Version 2.0), and the ratios in this paper were created by processing them. What this paper adds: dividing the rise in deaths from senility into the age composition, the age-specific rates, and the swapping of causes within the same age, and showing from one table that the age-specific rates trace a U shape with the bottom in 2005, that senility and three other causes moved in opposite directions at every age 80+, and that their balance tilts with age.
1. Notation and question
- Senility: Hi13 in the cause-of-death list for trends. Heart disease is "heart disease (excluding hypertensive)" (Hi05).
- Sum of the three: the sum of the death rates at the same age of pneumonia (Hi07), heart disease (excluding hypertensive) (Hi05), and cerebrovascular disease (Hi06).
- Age-composition part, rate part: the deaths with rates kept at the earlier year and only the population moved to the later year, and the deaths with the population kept at the earlier year and only the rates moved to the later year, each divided by the deaths in the earlier year.
- Rate: the death rate per 100,000 population.
Question: Did deaths from senility rise because there are more old people, or because the senility rate at the same age rose? If it rose, how did other causes at the same age move?
Observation 1.1: M001 showed that "the death rate rose" names two movements at once, the age composition and the age-specific rates. M020 showed that the leading cause of death in 1950 was tuberculosis, but adjusted to today's age structure it is old age (senility). This paper divides the rise in the number of senility deaths itself.
2. Survey and design
To be honest: the design was decided after seeing the tables.
| Content | |
|---|---|
| Table | Vital Statistics 2024 (final figures), Volume 1 Table 5.15 (deaths and death rates by cause of death for trends × sex × 5-year age × year) |
| Noticed in the survey | The number of senility deaths was lowest in 2000, but the senility rate at 80–89 was lowest in 2005; the bottom years differed |
| Years compared | 2005 (the bottom of the rate) and 2024. Because the cause-of-death classification was partly revised in 2017 (M041), 2005 to 2016 within the same classification is also shown |
| Measures | The age-composition part and rate part, the ratio of age-specific rates, the share of senility in all deaths, and the rise in senility ÷ the fall in the three |
3. Data and checks
Calculation 3.1 The retrieved file was fixed by SHA-256, and the following was checked.
- The table title is "Volume 1, Deaths, Table 5.15 … deaths and death rates (per 100,000 population)." The sheets "総数" (all causes), "13老衰," "07肺炎," "05心疾患," and "06脳血管疾患" are present, and the cause names are Hi13 senility, Hi07 pneumonia, Hi05 heart disease (excluding hypertensive), and Hi06 cerebrovascular disease.
- The years are the 24 years of every 5 years from 1950 to 2005, 2010, and 2014–2024, the same in every sheet.
- For every cause and year, total deaths = men + women, and for every cause, sex, and year, the sum of 5-year groups + unknown = total.
- The population was obtained as all-cause deaths ÷ death rate × 100,000. The population back-calculated the same way from the senility sheet agrees within a relative 0.00053 in the 191 cells from 2005 onward at ages 80+.
4. The age-composition part and the rate part
Calculation 4.1 Dividing the growth of senility deaths (21 five-year groups, excluding unknown age)
| Period | Deaths | Ratio | Age-composition part | Rate part | Product of the two |
|---|---|---|---|---|---|
| 2005→2024 | 26,360 → 206,885 | 7.85 | 2.51 | 3.25 | 8.15 |
| 2005→2016 | 26,360 → 92,836 | 3.52 | 1.80 | 1.98 | 3.55 |
| 2016→2024 | 92,836 → 206,885 | 2.23 | 1.39 | 1.62 | 2.26 |
Observation 4.2: The 7.85-fold rise from 2005 to 2024 divides into an age-composition part of 2.51-fold and a rate part of 3.25-fold. The product of the two, 8.15, agrees with the actual ratio within a relative 0.038. In all three periods, the rate part is larger than the age-composition part. More old people alone do not reach even half of the rise in senility deaths.
5. The age-specific rates traced a U shape
Observation 5.1: The senility rate at 85–89 fell from 10813.0 in 1950 to 290.3 in 2005, to 1/37.2, and came back to 1043.5 in 2024 (3.59 times 2005). At 80–84 it also fell from 5584.1 in 1950 to 68.6 in 2005, and was 299.0 in 2024. At both 80–84 and 85–89, 2005 is the lowest for both sexes combined, men, and women. The bottom of senility deaths (2000) and the bottom of the age-specific rates (2005) are not the same year.
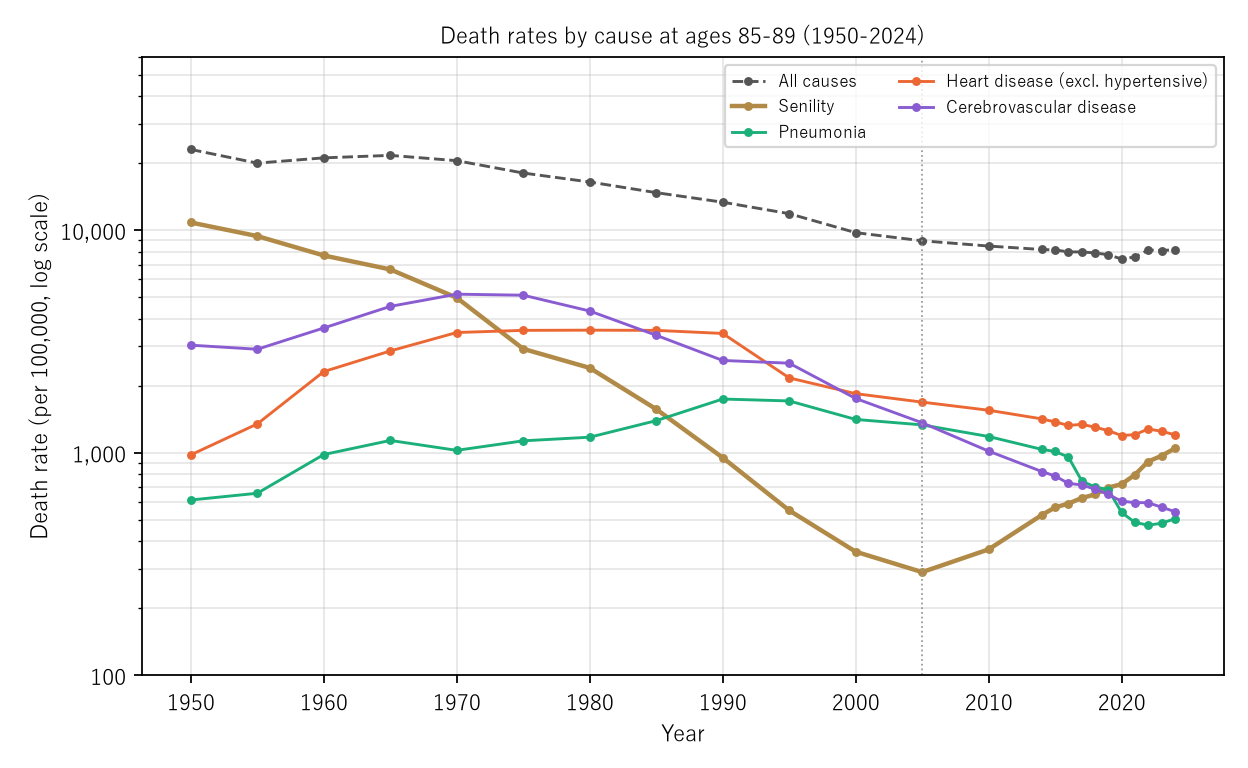
Figure 1: Death rates by cause at ages 85–89 (per 100,000; vertical axis logarithmic). Gold is senility, green pneumonia, orange heart disease (excluding hypertensive), purple cerebrovascular disease, and the gray dashed line all causes. The vertical dotted line is 2005.
6. Core — within the same age, senility and the three causes moved in opposite directions
Calculation 6.1 Rates by 5-year age group at 80+ (per 100,000; 2005 → 2024)
| Age | Senility | Senility ratio | Ratio of the three | All-cause ratio | Share of senility in all deaths |
|---|---|---|---|---|---|
| 80–84 | 68.6 → 299.0 | 4.36 | 0.50 | 0.85 | 0.013 → 0.069 |
| 85–89 | 290.3 → 1043.5 | 3.59 | 0.51 | 0.91 | 0.032 → 0.128 |
| 90–94 | 1080.0 → 3199.8 | 2.96 | 0.53 | 0.97 | 0.071 → 0.217 |
| 95–99 | 3044.6 → 8454.0 | 2.78 | 0.57 | 1.09 | 0.127 → 0.324 |
| 100+ | 8522.0 → 22666.7 | 2.66 | 0.59 | 1.26 | 0.226 → 0.478 |
Observation 6.2: At every 5-year age group 80+, the senility rate rose 2.66–4.36-fold, while the sum of the pneumonia, heart disease, and cerebrovascular disease rates fell to 0.50–0.59. The all-cause rate moved 0.85–1.26-fold, overlapping neither the senility range nor the range of the three. The senility ratio is smaller at older ages (4.36 at 80–84, 2.66 at 100+), but its share of all deaths is larger at older ages, reaching 0.478 at 100+. In 2005 to 2016, under the same classification, senility also rose at every age (1.79–2.20-fold) and the sum of the three fell (0.67–0.78).
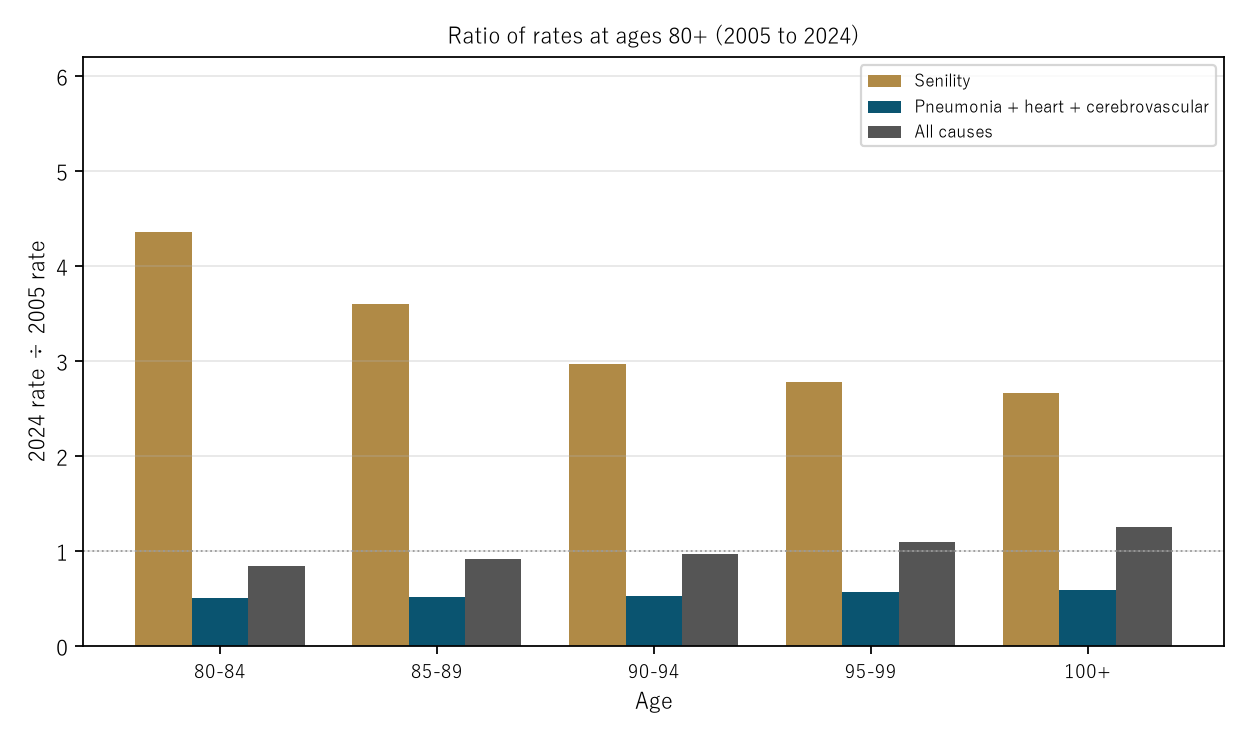
Figure 2: For each 5-year age group at 80+, the 2024 rate ÷ the 2005 rate. Gold is senility, navy the sum of pneumonia, heart disease, and cerebrovascular disease, and gray all causes. The dotted line is 1 (no change).
7. The balance between the rise and the fall tilts with age
Calculation 7.1 Rise in the senility rate ÷ fall in the sum of the three rates (per 100,000)
| Age | Rise in senility (2005→2024) | Fall in the three (2005→2024) | Ratio (2005→2024) | Ratio (2005→2016) |
|---|---|---|---|---|
| 80–84 | 230.4 | 1094.1 | 0.21 | 0.11 |
| 85–89 | 753.2 | 2129.2 | 0.35 | 0.22 |
| 90–94 | 2119.8 | 3781.3 | 0.56 | 0.42 |
| 95–99 | 5409.4 | 5456.5 | 0.99 | 1.05 |
| 100+ | 14144.7 | 7736.7 | 1.83 | 1.49 |
Observation 7.2: The ratio grows with age from 0.21 at 80–84 to 0.99 at 95–99 and 1.83 at 100+. At 80–84, only part of what the three causes lost was gained by senility, and the all-cause rate fell (0.85-fold). At 95–99, the rise and the fall are almost equal, and at 100+ the rise in senility is larger, and the all-cause rate rose (1.26-fold). In 2005 to 2016, under the same classification, the ratio also lines up in the same direction, from 0.11 to 1.49.
Observation 7.3: This pattern can be read either as a shift in "under which cause name a death is counted" within the same age, or as a change in how people actually die. These aggregate numbers cannot separate the two. What can be said is that the rise in senility names three things at once: the age composition, the age-specific rates, and the swapping within the same age.
8. Limitations
- The cause of death is the underlying cause, and which cause name it is counted under follows the death certificate and the classification rules. A change in how certificates are written and a change in how people die cannot be separated. It does not discuss whether the diagnosis of "senility" is right or wrong.
- The cause-of-death classification was partly revised in 2017 (the counting of pneumonia changed; M041). The fall in the three from 2005 to 2024 includes that part, so 2005 to 2016 within the same classification is also shown.
- The population was back-calculated from deaths ÷ death rate. Before 2005, the rate for 90–94 is the value for 90+, so detailed comparisons by age are from 2005 onward.
- National yearly totals; prefectures and facilities are not compared. It is not an outlook for any one person's death.
Conclusion
Deaths from senility rose from a bottom in 2000, and the 7.85-fold rise from 2005 to 2024 divided into an age-composition part of 2.51-fold and an age-specific-rate part of 3.25-fold. The senility rate at 85–89 fell to 1/37.2 from 1950 to 2005, hitting the bottom of a U shape, and came back 3.59-fold by 2024. At every age 80+, the senility rate rose 2.66–4.36-fold and the sum of the pneumonia, heart disease, and cerebrovascular disease rates fell to 0.50–0.59, and their balance was almost 1 (0.99) at 95–99.
Three things separate them — the age composition of the population, the age-specific rates, or the swapping of causes within the same age.
On hearing "more people are dying of senility," check together whether there are more old people, whether the share called senility at the same age rose, and how other causes at the same age moved.
Data and reproduction
| Data | Vital Statistics 2024 (final figures), Volume 1 Table 5.15 (Ministry of Health, Labour and Welfare; e-Stat) (retrieved 26 September 2026) |
| Terms of use | e-Stat follows the Government Standard Terms of Use (Version 2.0). The ratios in this paper were created by processing it and are not figures produced by the government |
| Scope | Japan, 1950–2024 |
| Checker | 検算/M055.py (--zu also draws the figures). Every number in the text is taken from 検算/M055_output.txt |
| Raw data | The retrieved file and SOURCES.md in data/ (URL, retrieval date, SHA-256, terms of use, definitions and how calculations are set up) |
| Figures | 図/M055_zu1, 図/M055_zu2 (png, svg, English versions) |
References
- Ministry of Health, Labour and Welfare. Vital Statistics 2024 (final figures), Volume 1 Table 5.15 (in Japanese). e-Stat (accessed 26 September 2026). https://www.e-stat.go.jp/
- Yamagishi, Y. (2026). "The Death Rate Rose" Names Two Movements at Once, the Age Composition and the Age-Specific Rates [M001]. Zenodo. https://doi.org/10.5281/zenodo.22963112
- Yamagishi, Y. (2026). In 1950 the Leading Cause of Death Was Tuberculosis, but Adjusted to Today's Age Structure It Is Old Age, and Tuberculosis Is Fifth [M020]. Zenodo. https://doi.org/10.5281/zenodo.22968057
- Yamagishi, Y. (2026). The Fall in Pneumonia Deaths in 2017 Is Nearly Predicted by the Ratio from Recoding the Same Death Records under the New and Old Classifications — for Pneumonia, an Actual Step of 0.826 Against a New/Old Ratio of 0.810, a Correlation of 0.969 Across 65 Causes, and the Lost Deaths Moved to Dementia, Alzheimer's Disease, Heart Failure, COPD, and Others [M041]. Zenodo. https://doi.org/10.5281/zenodo.22974374
Reference
Yamagishi, Y. (2026). Of the 7.85-Fold Rise in Deaths from Senility from 2005 to 2024, the Age Composition Accounts for 2.51-Fold and the Age-Specific Rates for 3.25-Fold [M055]. Zenodo.
DOI: 10.5281/zenodo.22975275
YOI: https://www.yamagishiyuuki.com/yoi/M055
ORCID: 0009-0006-8587-3450
PDF (English) · PDF (Japanese) · Date proof of the English PDF (OpenTimestamps .ots) · SHA256SUMS
The record page for this paper (in Japanese, with the PDFs in each language and the date proof): YOI M055. This paper is a preprint and has not been peer reviewed.