Abstract
Using the place of death in the Vital Statistics (1951–2024) and the tables of age (5-year groups) × place of death for 2005 and 2024, the movement in the share of deaths by place was divided into the age mix of those who die and the share by place at each age. It claims no new mathematical theorem and no new law.
First, the tables are consistent. In the yearly table, in-facility = sum of facilities, out-of-facility = home + other, and total = in-facility + out-of-facility hold in all 74 years; in the tables by age, the sums over places, ages, and sexes match the totals; and the 2005 and 2024 total rows agree between the two tables (Section 3).
Second, the share of deaths in hospital rose from 0.0905 in 1951, passed home (0.4397) in 1977 (0.4570), and peaked at 0.7975 in 2005. In 2024 it is 0.6439. The share at home fell from 0.8247 in 1951 to 0.1216 in 2006, came back to 0.1742 in 2022, and is 0.1638 in 2024. Nursing homes for the elderly went from 0.0215 in 2005 to 0.1221 in 2024 (Section 4).
Third, this is the core of the paper. Of the fall of −0.1538 in the hospital share from 2005 to 2024, the age-mix part is −0.0129 and the age-specific-share part is −0.1409 (0.916). The share of those who die at 90+ went from 0.173 to 0.319, but what lowered the hospital share was mainly movement within the same age. The rise of +0.0413 at home is the sum of +0.0537 from age-specific shares and −0.0124 from the age mix, in opposite directions. For nursing homes, both parts are upward (+0.0218 and +0.0788) (Section 5).
Fourth, the share at home rose from 0.131 to 0.273 (2.09-fold) at 60–64 and rose at every age from 60 to 89, while it fell at 90+ (from 0.133 to 0.117 at 90–94). The age with the lowest share at home moved from 70–74 in 2005 to 90–94 in 2024. The direction is the same for both men and women (Section 6).
Fifth, at older ages, nursing homes take a larger share instead of home. The nursing-home share is larger at older ages in both 2005 and 2024, and at 100+ in 2024 it is 0.316, 2.26 times that at home (0.140) (Section 6).
Sixth, what separates them is whether the age mix of those who die moved or the share by place moved within the same age. "More people are dying at home" bundles opposite directions by age into one number.
Scope note: This paper claims no new mathematical theorem and no new law — the place of death is in public tables, and the method of dividing into age mix and age-specific shares is long established. This paper is a structural interpretation of the shape of numbers in public aggregate data; it is not medical advice, not a diagnosis, and not a treatment recommendation. The author is not a physician. Decisions about individual health should be discussed with a physician or a medical institution. This is a preprint that has not been peer reviewed. It does not discuss where it is better to die. The categories of place are taken by their names in the table; the contents of facilities, and whether a death was attended or sudden, are not distinguished. Deaths at home have a higher share of deaths with an unclear cause than deaths in hospital (M022). Until 1994, deaths in nursing homes were counted under home or other, and until 2017 the long-term care facility category counted only geriatric health service facilities (notes to the table). It does not judge hospitals, facilities, or municipalities, and does not compare prefectures. Considering that families who cared for someone at the end of life may read it, it is not written as an outlook for any one person's death. About the data: the Vital Statistics (e-Stat) are used under the Government Standard Terms of Use (Version 2.0), and the shares in this paper were created by processing them. What this paper adds: dividing the 2005 to 2024 movement in the share of deaths by place into the age mix of those who die and the age-specific shares by place, and showing that the fall in hospital is almost entirely movement within the same age, and that the rise at home is the sum of two opposite parts, rising at 60–89 and falling at 90+.
1. Notation and question
- Categories of place: hospital, clinic, long-term care facility (in 2005, geriatric health service facilities; in 2024, integrated care hospitals and geriatric health service facilities), nursing home for the elderly, home, and other (including maternity homes) — six in all.
- Share by place: deaths at that place ÷ deaths.
- Age-mix part, age-specific-share part: the share by place = Σ (share of deaths at age a × share at that place at age a). The difference between two years is divided into the sum of (difference in the share of deaths at each age × average of the place shares) (the age-mix part) and the sum of (difference in the place share × average of the shares of deaths at each age) (the age-specific-share part). The two add up to the difference itself.
Question: Did the share of deaths in hospital fall and the shares at home and in facilities rise because those who die are older, or because the place of death changed at the same age?
Observation 1.1: M022 showed that the share of deaths with an unclear cause is far higher at home than in hospital. M049 showed, with the same division, that the age-composition part of movements in averages differs in direction and size by measure. This paper applies that division to the place of death.
2. Survey and design
To be honest: the design was decided after seeing the tables.
| Content | |
|---|---|
| Tables | Vital Statistics 2024 (final figures), Volume 1 Table 5.5 (place of death × year, 1951–2024), Volume 2 Table 8 (2024, age × sex × place of death), and the 2005 Volume 2 Table 8 (same form) |
| Noticed in the survey | The hospital share peaked in 2005 and the home share hit bottom in 2006. The age × place table exists for each year, so the peak year 2005 is compared with 2024 |
| How categories were aligned | "Geriatric health service facilities" in 2005 and "integrated care hospitals and geriatric health service facilities" in 2024 are both "long-term care facility," and maternity homes go into "other" |
| Measures | The share by place, the age-mix part and the age-specific-share part, and the share by place at each age |
3. Data and checks
Calculation 3.1 The 3 retrieved files were fixed by SHA-256, and the following was checked.
- The title of Table 5.5 is "Volume 1, Deaths, Table 5.5: deaths by place of death and year," the 2024 Volume 2 Table 8 is "Volume 2, Deaths, Table 8: deaths by age (5-year groups), sex, and place of death," and the 2005 one is "Volume 2, Deaths, Table 8" / "deaths by sex, place of death, and age (5-year groups)."
- In Table 5.5, in-facility = sum of facilities, out-of-facility = home + other, and total = in-facility + out-of-facility hold in all 74 years.
- In Volume 2 Table 8 (2005 and 2024), sum of places = total, sum of 5-year groups + unknown = total, and total = men + women.
- The 2005 and 2024 rows of Table 5.5 agree with the total rows of Volume 2 Table 8 in the six places and the total.
4. Movement over the years in the share by place
Calculation 4.1 Share of deaths by place (Table 5.5)
| Year | Hospital | Home | Nursing home | Care facility | Clinic |
|---|---|---|---|---|---|
| 1951 | 0.0905 | 0.8247 | 0.0000 | 0.0000 | 0.0256 |
| 1960 | 0.1816 | 0.7068 | 0.0000 | 0.0000 | 0.0367 |
| 1970 | 0.3295 | 0.5665 | 0.0000 | 0.0000 | 0.0448 |
| 1977 | 0.4570 | 0.4397 | 0.0000 | 0.0000 | 0.0488 |
| 1990 | 0.7161 | 0.2166 | 0.0000 | 0.0004 | 0.0341 |
| 2000 | 0.7816 | 0.1389 | 0.0185 | 0.0050 | 0.0282 |
| 2005 | 0.7975 | 0.1224 | 0.0215 | 0.0068 | 0.0264 |
| 2010 | 0.7785 | 0.1260 | 0.0352 | 0.0131 | 0.0241 |
| 2015 | 0.7459 | 0.1271 | 0.0633 | 0.0226 | 0.0197 |
| 2020 | 0.6834 | 0.1574 | 0.0916 | 0.0332 | 0.0156 |
| 2022 | 0.6445 | 0.1742 | 0.1101 | 0.0393 | 0.0138 |
| 2024 | 0.6439 | 0.1638 | 0.1221 | 0.0412 | 0.0119 |
Observation 4.2: The hospital share rose from 0.0905 in 1951, passed home in 1977 (hospital 0.4570, home 0.4397), and peaked at 0.7975 in 2005. It then fell to 0.6439 in 2024. The home share rose from a bottom of 0.1216 in 2006, and after 0.1742 in 2022 fell in 2023 and 2024. Nursing homes and care facilities have kept rising since they began to be counted in the table.
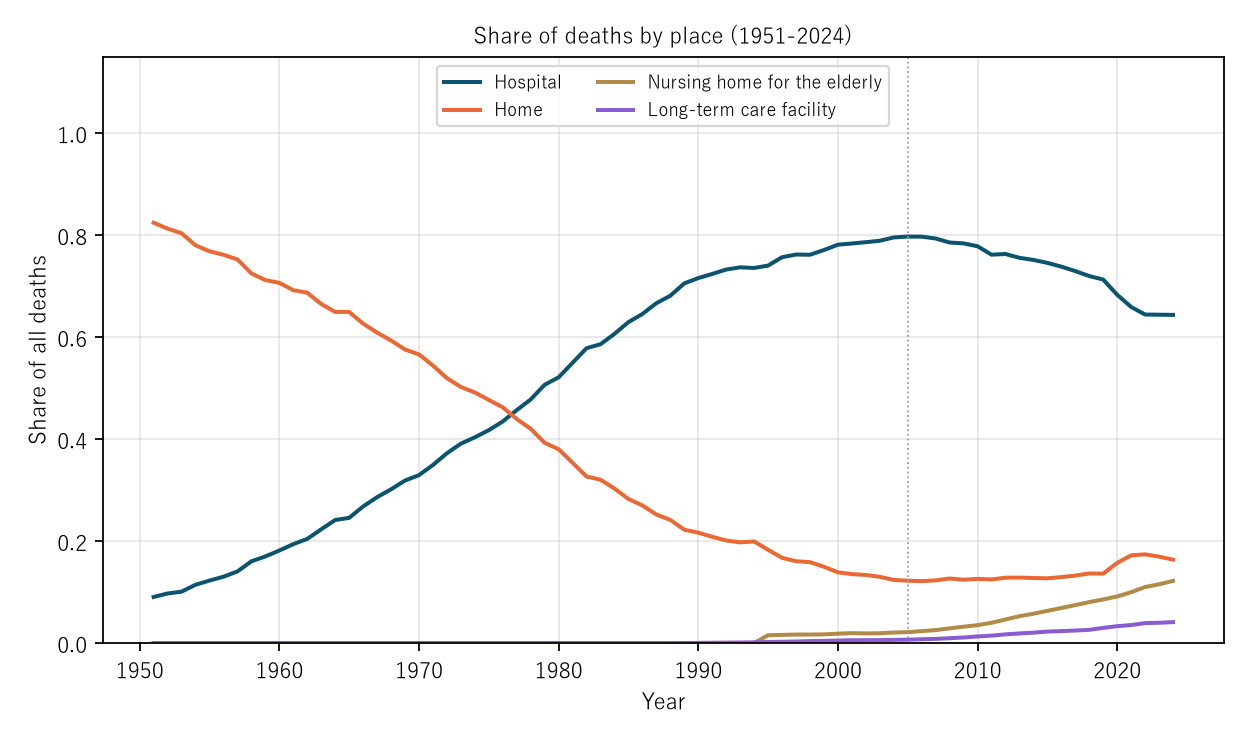
Figure 1: Share of deaths by place (1951–2024). Navy is hospital, orange home, gold nursing homes for the elderly, and purple integrated care hospitals and geriatric health service facilities. The vertical dotted line is 2005. Until 1994, deaths in nursing homes are included in home or other.
5. Core — the age-mix part and the age-specific-share part
Calculation 5.1 Dividing the 2005 → 2024 difference in the share by place (21 five-year groups, excluding unknown age)
| Place | 2005 | 2024 | Difference | Age-mix part | Age-specific-share part |
|---|---|---|---|---|---|
| Hospital | 0.7979 | 0.6441 | −0.1538 | −0.0129 | −0.1409 |
| Clinic | 0.0264 | 0.0119 | −0.0145 | +0.0033 | −0.0177 |
| Long-term care facility | 0.0068 | 0.0412 | +0.0344 | +0.0076 | +0.0268 |
| Nursing home for the elderly | 0.0215 | 0.1221 | +0.1006 | +0.0218 | +0.0788 |
| Home | 0.1225 | 0.1638 | +0.0413 | −0.0124 | +0.0537 |
| Other | 0.0250 | 0.0169 | −0.0081 | −0.0074 | −0.0007 |
Observation 5.2: Of the fall of −0.1538 in hospital, the age-mix part is −0.0129 and the age-specific-share part −0.1409; 0.916 is movement within the same age. The share of those who die at 90+ rose from 0.173 to 0.319, but that was not mainly what lowered the hospital share. At home, the age-mix part is −0.0124 and the age-specific-share part +0.0537, in opposite directions. The rise in the age of those who die worked to lower the home share (−0.0124), and the rise within the same age (+0.0537) outweighed it. For nursing homes, both parts are upward (+0.0218, +0.0788). The differences of the six places sum to 0, and the two parts add up to the difference for every place.
6. The share by place at each age
Calculation 6.1 Share by place at each age 60+ (2005 → 2024)
| Age | Hospital | Home | Nursing home | Care facility | Share of those who die |
|---|---|---|---|---|---|
| 60–64 | 0.812 → 0.664 | 0.131 → 0.273 | 0.001 → 0.024 | 0.000 → 0.004 | 0.057 → 0.026 |
| 65–69 | 0.842 → 0.684 | 0.114 → 0.249 | 0.003 → 0.033 | 0.001 → 0.007 | 0.075 → 0.041 |
| 70–74 | 0.853 → 0.696 | 0.104 → 0.219 | 0.006 → 0.049 | 0.002 → 0.012 | 0.112 → 0.078 |
| 75–79 | 0.846 → 0.707 | 0.105 → 0.190 | 0.011 → 0.063 | 0.004 → 0.019 | 0.147 → 0.117 |
| 80–84 | 0.829 → 0.699 | 0.105 → 0.159 | 0.020 → 0.089 | 0.007 → 0.030 | 0.161 → 0.164 |
| 85–89 | 0.802 → 0.669 | 0.111 → 0.132 | 0.032 → 0.129 | 0.011 → 0.046 | 0.153 → 0.200 |
| 90–94 | 0.753 → 0.609 | 0.133 → 0.117 | 0.050 → 0.182 | 0.016 → 0.064 | 0.118 → 0.191 |
| 95–99 | 0.694 → 0.522 | 0.158 → 0.121 | 0.079 → 0.243 | 0.022 → 0.083 | 0.047 → 0.103 |
| 100+ | 0.613 → 0.402 | 0.186 → 0.140 | 0.122 → 0.316 | 0.031 → 0.108 | 0.009 → 0.026 |
Observation 6.2: The share at home went from 0.131 to 0.273 (2.09-fold) at 60–64 and rose at every age from 60 to 89, but fell at 90–94, 95–99, and 100+. The age with the lowest share at home moved from 70–74 in 2005 to 90–94 in 2024. By sex, at 60–64 it rose for men from 0.138 to 0.286 and for women from 0.115 to 0.244, and at 90–94 it fell for men from 0.129 to 0.121 and for women from 0.134 to 0.114. The hospital share fell at every age 60+, and the nursing-home share rose at every age. The nursing-home share is larger at older ages in both 2005 and 2024, and at 100+ in 2024 it is 0.316, 2.26 times that at home (0.140).
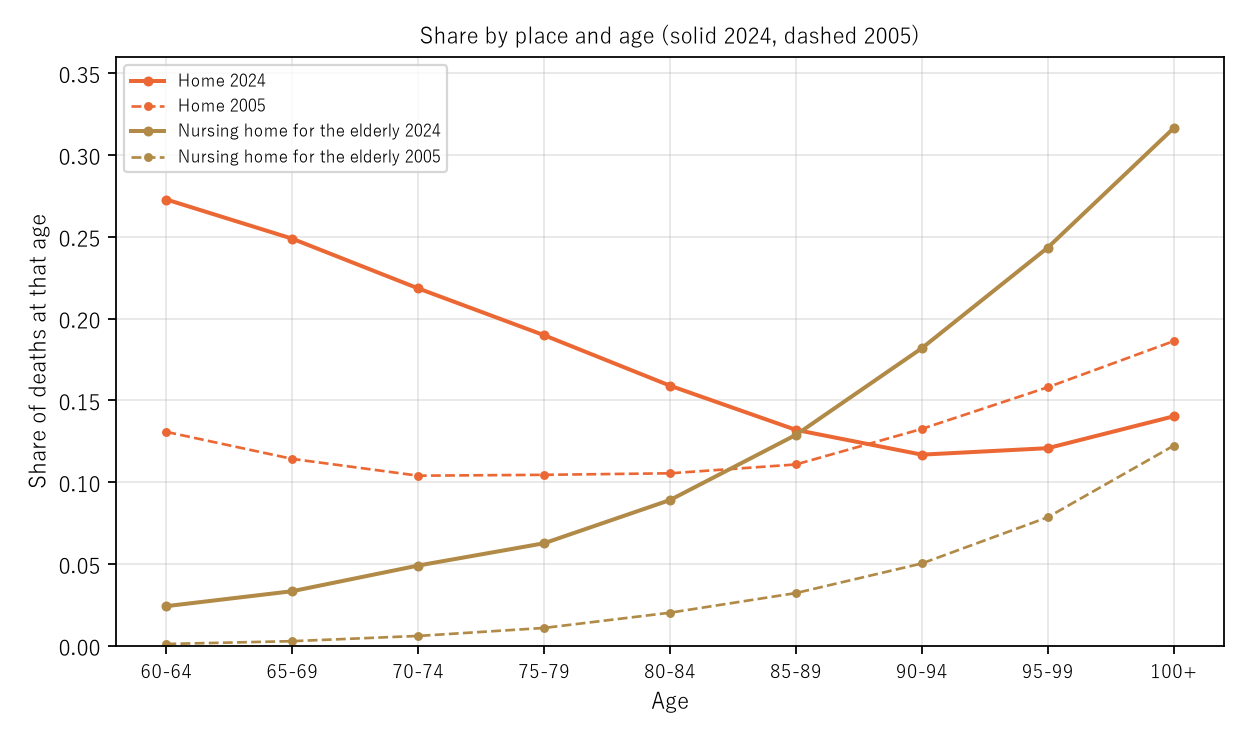
Figure 2: For each age 60+, the shares at home (orange) and in nursing homes (gold). Solid lines are 2024 and dashed lines 2005.
7. Limitations
- The categories of place are taken by their names in the table; the contents of facilities, whether a death was attended or sudden, and where the person spent the time before death are not known. Deaths at home have a higher share of unclear causes than in hospital (M022), so what the rise in the home share at younger ages is a rise of cannot be said from this table.
- The categories changed over the years: until 1994, deaths in nursing homes are included in home or other, and until 2017 the care facility category is only geriatric health service facilities. In the 2005–2024 comparison, the contents of "care facility" are not the same.
- It does not discuss where it is better to die. Hospitals, facilities, and municipalities are not compared.
- Age differences within a 5-year group, differences by cause, and prefectures are not examined. It is not an outlook for any one person's death.
Conclusion
The share of deaths in hospital passed home in 1977, peaked at 0.7975 in 2005, and fell to 0.6439 in 2024. 0.916 of that fall was not the age mix of those who die but movement within the same age. The rise in the share at home is the sum of a rise in age-specific shares (+0.0537) and a fall from the age mix (−0.0124); by age, it rose at 60–89 and fell at 90+. At the oldest ages, the nursing-home share is far above that at home.
One thing separates them — whether the age mix of those who die moved or the share by place moved within the same age.
On hearing "more people are dying at home," check together which ages it is about, and in which direction the rising age of those who die pushed it.
Data and reproduction
| Data | Vital Statistics 2024 (final figures), Volume 1 Table 5.5 and Volume 2 Table 8, and 2005 Volume 2 Table 8 (Ministry of Health, Labour and Welfare; e-Stat) (retrieved 26 September 2026) |
| Terms of use | e-Stat follows the Government Standard Terms of Use (Version 2.0). The shares in this paper were created by processing it and are not figures produced by the government |
| Scope | Japan, 1951–2024 (by age, 2005 and 2024) |
| Checker | 検算/M057.py (--zu also draws the figures). Every number in the text is taken from 検算/M057_output.txt |
| Raw data | The 3 retrieved files and SOURCES.md in data/ (URLs, retrieval date, SHA-256, terms of use, definitions and how calculations are set up) |
| Figures | 図/M057_zu1, 図/M057_zu2 (png, svg, English versions) |
References
- Ministry of Health, Labour and Welfare. Vital Statistics 2024 (final figures), Volume 1 Table 5.5 and Volume 2 Table 8; 2005, Volume 2 Table 8 (in Japanese). e-Stat (accessed 26 September 2026). https://www.e-stat.go.jp/
- Yamagishi, Y. (2026). The Share of Deaths with an Ill-Defined Cause Is 8.19 Times Higher at Home Than in Hospital, and Peaks at Ages 55–59 [M022]. Zenodo. https://doi.org/10.5281/zenodo.22968281
- Yamagishi, Y. (2026). Of the Movement in Means at Ages 20+, the Part Due to Respondents' Age Composition Differs in Direction and Size by Indicator — From 2013 to 2023 It Is 0.077 of Women's BMI Rise of 0.103 and 0.140–0.151 of the Fall in Steps, Nearly 0 for Men's Salt, and for Potassium It Offsets 0.375–0.682 of the Age-Specific Fall [M049]. Zenodo. https://doi.org/10.5281/zenodo.22974769
Reference
Yamagishi, Y. (2026). The Share of Deaths in Hospital Peaked at 0.7975 in 2005 and Fell to 0.6439 by 2024, and 0.916 of That Fall Was Movement Within the Same Age [M057]. Zenodo.
DOI: 10.5281/zenodo.22975621
YOI: https://www.yamagishiyuuki.com/yoi/M057
ORCID: 0009-0006-8587-3450
PDF (English) · PDF (Japanese) · Date proof of the English PDF (OpenTimestamps .ots) · SHA256SUMS
The record page for this paper (in Japanese, with the PDFs in each language and the date proof): YOI M057. This paper is a preprint and has not been peer reviewed.