Abstract
The number certified as needing long-term care or support in the Survey of Long-term Care Benefit Expenditures (July 2025) was divided by the Population Estimates (1 July 2025, final figures) to obtain the certification rate by age, and how many times it grows per 5 years and how many years it takes to double were lined up against the death rate at the same ages (Vital Statistics, 2024). It claims no new mathematical theorem and no new law.
First, the tables are consistent. For the certified, the sums over levels, ages, and sexes match the totals within the rounding width (0.2 thousand), and for the population, the sums over 5-year groups and sexes match the totals within 1 thousand (Section 3).
Second, the certification rate rises with age, from 0.0290 at 65–69 to 0.7160 at 90–94 and 0.880 at 95+. At 65+ it is 0.2041. For both sexes, men, and women, each age group is higher than the one below (Section 4).
Third, this is the core of the paper. For both sexes, the certification rate doubles every 4.97, 4.90, and 4.26 years in the three steps from 65–69 to 80–84, faster than the death rate in the same steps (6.56, 7.90, 5.87 years). In the two steps beyond 80–84 (80–84→85–89 and 85–89→90–94), certification takes 5.70 and 9.12 years and the death rate 5.45 and 5.88 years, so the death rate becomes faster. The order is the same for men and women; in the last step it is 8.03 against 6.30 years for men and 10.39 against 5.00 years for women (Section 5).
Fourth, what slowed down was the light levels. The share at the support levels (support levels 1 and 2) has a ratio in the last step of 1.07 for both sexes (51.17 years to double), nearly flat, and for women 0.95, falling. Counting only care levels 3–5, it doubles every 5.50, 5.46, 4.64, 4.85, and 5.61 years for both sexes, and keeps doubling up to 90–94. For both sexes, men, and women, every step falls within 4.06–6.53 years (Section 6).
Fifth, at 90–94 the share at care levels 3–5 (0.2807) exceeds that at the support levels (0.1604). At the ages where the certification rate approaches 1, the years to double for all levels lengthen, and what lies inside is a shift of weight from the light levels to the heavy levels (Section 6).
Sixth, what separates them is whether the light levels are counted or only the heavy levels. "The share needing care also doubles with age" can look faster or slower than the death rate depending on which levels are counted.
Scope note: This paper claims no new mathematical theorem and no new law — the certified counts and population are in public tables, and the method of measuring how fast something doubles with age is long established. This paper is a structural interpretation of the shape of numbers in public aggregate data; it is not medical advice, not a diagnosis, and not a treatment recommendation. The author is not a physician. Decisions about individual health should be discussed with a physician or a medical institution. This is a preprint that has not been peer reviewed. The certified count is the number of people who applied, were certified as needing care or support, and are registered; it is not the number of people who need care itself. People who do not apply, and how certification and levels are decided, cannot be seen in these tables. It does not judge the long-term care insurance system, municipalities, or providers. The population denominator is the total population (including people in hospitals and facilities). It is a comparison of age differences in one month (July 2025), not how the same people change as they age. Considering that family caregivers and people receiving care may read it, it is not written as an outlook for any one person. About the data: the Survey of Long-term Care Benefit Expenditures, the Population Estimates, and the Vital Statistics (e-Stat) are used under the Government Standard Terms of Use (Version 2.0), and the rates, ratios, and years in this paper were created by processing them. What this paper adds: lining up, step by step, the years for the share certified as needing care to double with age against the death rate at the same ages, and showing that certification is faster at 65–84 and reverses from 85, that the reversal comes from the support levels leveling off, and that counting only care levels 3–5 it keeps doubling up to 90–94.
1. Notation and question
- Certification rate: the number certified as needing care or support in an age group ÷ the total population of that age group.
- Ratio per 5 years: the ratio of rates between adjacent 5-year age groups.
- Years to double: 5 × log 2 ÷ log (ratio). Also obtained from the slope of a straight line fitted to log (rate) at the 6 points for ages 65–94.
- Levels: support levels (support levels 1 and 2), care levels 3–5.
- Death rate: the 2024 all-cause death rate (per 100,000 population).
Question: Does the share certified as needing care double with age at the same pace as the death rate? If the pace changes, which levels change it?
Observation 1.1: M002 showed that the pace at which the adult death rate doubles with age hardly moves. M019 showed that the pace differs by cause and that the overall pace is a mixture of them. This paper applies the same measure to the share certified as needing care or support.
2. Survey and design
To be honest: the design was decided after seeing the tables.
| Content | |
|---|---|
| Tables | Survey of Long-term Care Benefit Expenditures, monthly report for August 2025 review, Table 19 (certified × level × sex × age group), Population Estimates (1 July 2025, final figures), and Vital Statistics Table 5.15 (2024 death rates) |
| Aligning the month | The certified are those registered in the month before the review month (the service month, July 2025), so the population was aligned to 1 July 2025. The provisional population estimates are in units of 10 thousand and coarse, so the final figures in thousands were used |
| Ages | 40–64 is not compared because certification is limited for that group. 95+ is open-ended and is not used for the years to double |
| Measures | The certification rate, the ratio per 5 years, the years to double, and the same measures by level |
3. Data and checks
Calculation 3.1 The 3 retrieved files were fixed by SHA-256, and the following was checked.
- The certified table is "August 2025 review" / "Monthly report Table 19: number certified by level of care need (support), sex, and age group," and its note says "those registered in the recipient ledger during the month before the review month (the service month)." The unit is thousands, and the levels are total, support levels 1–2, and care levels 1–5.
- The rounding differences are at most 0.2 between the sum over levels and the total, 0.2 between the sum over ages and the total, and 0.1 between men + women and the total (thousands).
- The population is "Population by age (5-year groups) and sex," "as of 1 July 2025 (final figures)" (thousands). The differences are at most 1 between the sum of the 21 five-year groups and the total, and at most 1 between men + women and both sexes (thousands).
- The death rate is the "総数" (all causes) sheet of Table 5.15 for 2024.
4. The certification rate
Calculation 4.1 Certification rate by age (July 2025)
| Age | Both sexes | Men | Women |
|---|---|---|---|
| 65–69 | 0.0290 | 0.0329 | 0.0253 |
| 70–74 | 0.0582 | 0.0615 | 0.0553 |
| 75–79 | 0.1180 | 0.1098 | 0.1248 |
| 80–84 | 0.2665 | 0.2177 | 0.3011 |
| 85–89 | 0.4897 | 0.3941 | 0.5452 |
| 90–94 | 0.7160 | 0.6068 | 0.7612 |
| 95+ | 0.880 | 0.770 | 0.909 |
Observation 4.2: The certification rate goes from 0.0290 at 65–69 to 0.2665 at 80–84, 0.7160 at 90–94, and 0.880 at 95+. At 65+ it is 0.2041 for both sexes, 0.1509 for men, and 0.2448 for women. For both sexes, men, and women, each age group is higher than the one below.
5. Core — how fast certification and death double
Calculation 5.1 Years to double by step
| Step | Certification (both) | Death (both) | Certification (men) | Death (men) | Certification (women) | Death (women) |
|---|---|---|---|---|---|---|
| 65–69→70–74 | 4.97 | 6.56 | 5.54 | 6.39 | 4.44 | 6.44 |
| 70–74→75–79 | 4.90 | 7.90 | 5.97 | 7.99 | 4.25 | 6.93 |
| 75–79→80–84 | 4.26 | 5.87 | 5.07 | 6.08 | 3.93 | 4.98 |
| 80–84→85–89 | 5.70 | 5.45 | 5.84 | 5.72 | 5.84 | 4.65 |
| 85–89→90–94 | 9.12 | 5.88 | 8.03 | 6.30 | 10.39 | 5.00 |
| Straight line (65–94) | 5.22 | 6.22 | 5.82 | 6.42 | 4.90 | 5.42 |
Observation 5.2: For both sexes, certification doubles faster in the three steps from 65–69 to 80–84 (4.97, 4.90, 4.26 years against 6.56, 7.90, 5.87), and the death rate is faster in the two steps beyond 80–84 (5.70, 9.12 years against 5.45, 5.88). For men and women too, certification is faster in 3 steps and the death rate in 2, in the same order. Fitting a straight line to ages 65–94 gives 5.22 years for certification and 6.22 years for the death rate for both sexes. A single straight line hides the slowdown from 85.
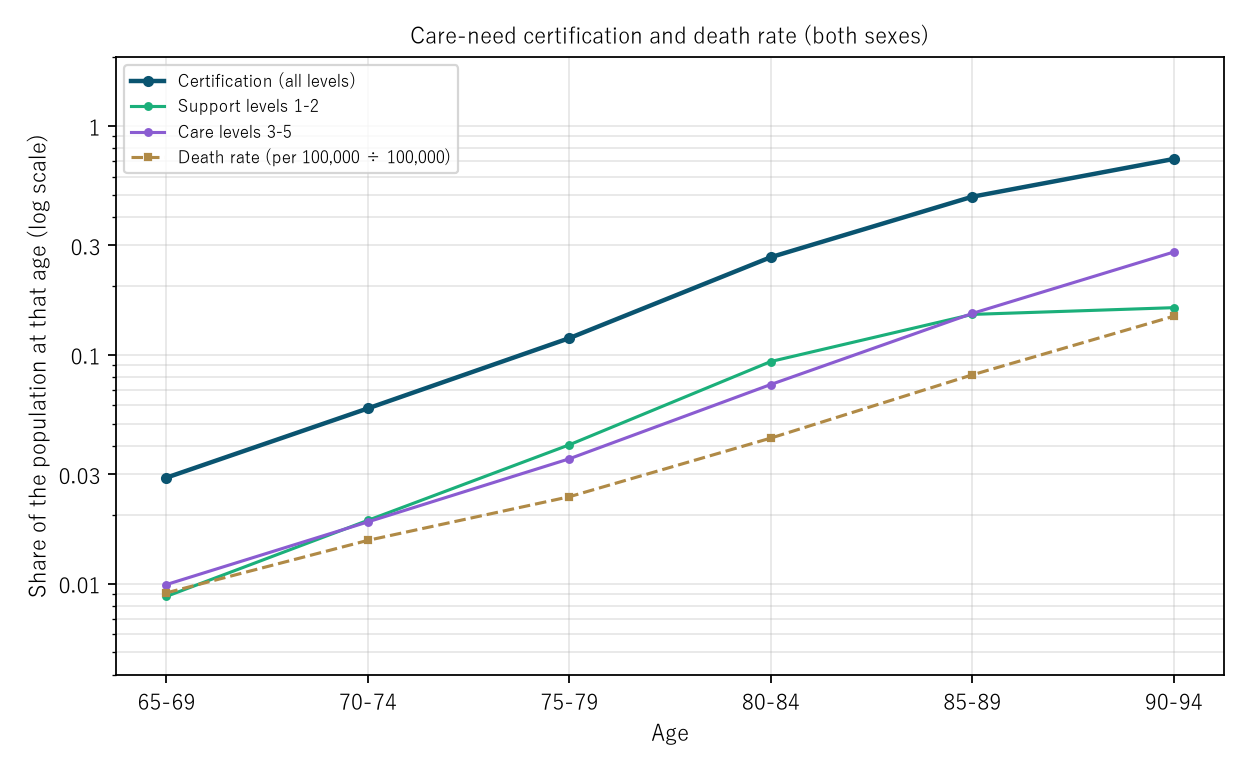
Figure 1: By age, the certification rate (navy, all levels), support levels 1–2 (green), care levels 3–5 (purple), and the death rate (gold dashed, per 100,000 divided by 100,000). Both sexes; vertical axis logarithmic.
6. By level — the support levels slowed down
Calculation 6.1 Ratio per 5 years and years to double by level (both sexes)
| Step | Support ratio | Support years | Care 3–5 ratio | Care 3–5 years |
|---|---|---|---|---|
| 65–69→70–74 | 2.15 | 4.53 | 1.88 | 5.50 |
| 70–74→75–79 | 2.14 | 4.56 | 1.89 | 5.46 |
| 75–79→80–84 | 2.31 | 4.14 | 2.11 | 4.64 |
| 80–84→85–89 | 1.61 | 7.31 | 2.04 | 4.85 |
| 85–89→90–94 | 1.07 | 51.17 | 1.86 | 5.61 |
Observation 6.2: The share at the support levels doubles every 4.14–4.56 years up to 80–84, but then its ratio drops to 1.61 and 1.07, and the last step is nearly flat (51.17 years). For women, the ratio in the last step is 0.95, below 1. Care levels 3–5 double every 5.50, 5.46, 4.64, 4.85, and 5.61 years, at a similar pace up to 90–94, and for both sexes, men, and women every step falls within 4.06–6.53 years. At 90–94 the share at care levels 3–5 (0.2807) exceeds that at the support levels (0.1604). The lengthening of the years to double for all levels from 85 coincides with the light levels leveling off and the share at the heavy levels growing.
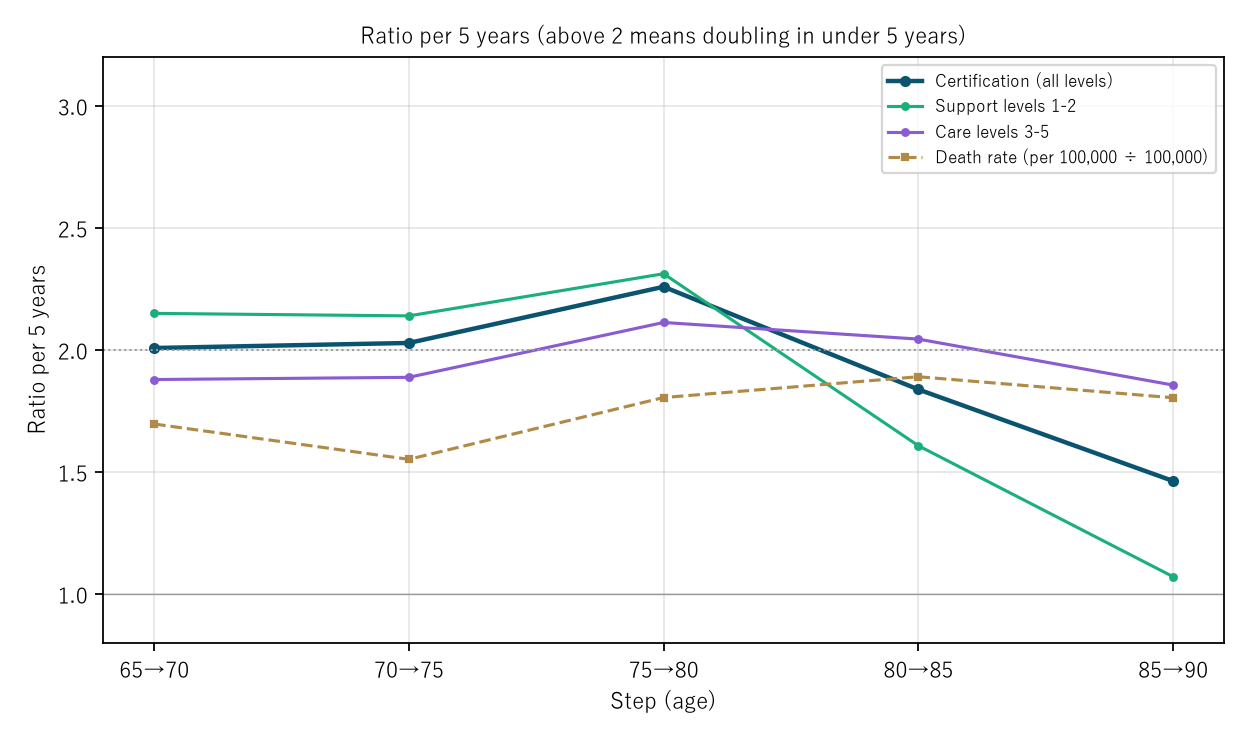
Figure 2: Ratio per 5 years by step (both sexes). Navy is certification (all levels), green support levels 1–2, purple care levels 3–5, and gold dashed the death rate. Above the dotted line at 2, it doubles in under 5 years.
7. Limitations
- The certified count is the number who applied, were certified, and are registered; it is not the number who need care itself. How people apply and how levels are decided cannot be seen in these tables.
- It is a comparison of age differences in one month, not how the same people change as they age. The movement of levels becoming heavier itself cannot be seen in this table.
- The population denominator is the total population. The death rate is for 2024 and certification for July 2025, so the years differ.
- 40–64, and 95+ for the years to double, are not compared. Prefectures and municipalities are not compared. It is not an outlook for any one person.
Conclusion
The share certified as needing care or support doubled every 4.26–4.97 years at 65–84, faster than the death rate at the same ages (5.87–7.90 years). From 85 it slowed, and in the step from 85–89 to 90–94 it took 9.12 years, slower than the death rate (5.88 years). That slowdown was the support levels leveling off (51.17 years), and counting only care levels 3–5 it kept doubling every 4.64–5.61 years up to 90–94.
One thing separates them — whether the light levels are counted or only the heavy levels.
On hearing how the share needing care grows with age, check together which levels the share counts, and which step of age it is about.
Data and reproduction
| Data | Survey of Long-term Care Benefit Expenditures, monthly report for August 2025 review, Table 19 (Ministry of Health, Labour and Welfare); Population Estimates, 1 July 2025 (final figures) (Statistics Bureau, Ministry of Internal Affairs and Communications); Vital Statistics 2024 (final figures), Volume 1 Table 5.15 (Ministry of Health, Labour and Welfare) (all from e-Stat; retrieved 26 September 2026) |
| Terms of use | e-Stat follows the Government Standard Terms of Use (Version 2.0). The rates, ratios, and years in this paper were created by processing these and are not figures produced by the government |
| Scope | Japan, July 2025 (death rate 2024) |
| Checker | 検算/M058.py (--zu also draws the figures). Every number in the text is taken from 検算/M058_output.txt |
| Raw data | The 3 retrieved files and SOURCES.md in data/ (URLs, retrieval date, SHA-256, terms of use, definitions and how calculations are set up) |
| Figures | 図/M058_zu1, 図/M058_zu2 (png, svg, English versions) |
References
- Ministry of Health, Labour and Welfare. Survey of Long-term Care Benefit Expenditures, monthly report for August 2025 review, Table 19 (in Japanese). e-Stat (accessed 26 September 2026). https://www.e-stat.go.jp/
- Ministry of Health, Labour and Welfare. Vital Statistics 2024 (final figures), Volume 1 Table 5.15 (in Japanese). e-Stat (accessed 26 September 2026). https://www.e-stat.go.jp/
- Statistics Bureau, Ministry of Internal Affairs and Communications. Population Estimates, population as of the 1st of each month, Table 1, population by age (5-year groups) and sex (final figures for July 2025, provisional for December 2025) (in Japanese). e-Stat (accessed 26 September 2026). https://www.e-stat.go.jp/
- Yamagishi, Y. (2026). The Speed at Which Adult Death Rates Double with Age Hardly Moved; What Fell Was the Level [M002]. Zenodo. https://doi.org/10.5281/zenodo.22963210
- Yamagishi, Y. (2026). Men's 6.99-Year Doubling Time of the Death Rate Is a Mixture Ranging from Pneumonia at 4.80 Years to Liver Disease at 14.52 [M019]. Zenodo. https://doi.org/10.5281/zenodo.22967853
Reference
Yamagishi, Y. (2026). The Share Certified as Needing Care Doubles Every 4.26–4.97 Years at Ages 65–84, Faster Than the Death Rate at the Same Ages (5.87–7.90 Years) [M058]. Zenodo.
DOI: 10.5281/zenodo.22975817
YOI: https://www.yamagishiyuuki.com/yoi/M058
ORCID: 0009-0006-8587-3450
PDF (English) · PDF (Japanese) · Date proof of the English PDF (OpenTimestamps .ots) · SHA256SUMS
The record page for this paper (in Japanese, with the PDFs in each language and the date proof): YOI M058. This paper is a preprint and has not been peer reviewed.