Abstract
Using the 2025 Comprehensive Survey of Living Conditions (long-term care questionnaire), when the main caregiver is family, the caregiver's relationship and age were lined up by the age and sex of the person receiving care. The numbers are "per 100,000 people needing care." It claims no new mathematical theorem and no new law.
First, the tables are consistent. The sums over relationships and over care time match the totals within the rounding width (at most 1), and the co-resident total (46,061) and the co-resident numbers by age of the person receiving care agree across the four tables (Section 3).
Second, when family is the main caregiver, 0.383 are spouses, 0.498 children, and 0.080 children-in-law, and 0.732 of caregivers are 60+ and 0.388 are 70+. If the caregiver is 80+, 0.974 are spouses; if 50–59, 0.821 are children (Section 4).
Third, this is the core of the paper. The share of co-resident caregivers aged 65+ is highest at 0.836 when the person receiving care is 70–74, lowest at 0.473 at 85–89, and returns to 0.594 at 90+. Over the same span, the share of spouses falls from 0.857 to 0.122 and the share of children rises from 0.111 to 0.641. When the person receiving care is 90+, 0.570 of co-resident caregivers are aged 60–69. At 90+, children-in-law (0.209) also exceed spouses (Section 5).
Fourth, the share where both the person receiving care and the caregiver are 65+ is 0.619, and where both are 75+ it is 0.371 (co-resident, Section 5).
Fifth, the share cared for by a spouse differs greatly by the sex of the person receiving care. At every age 65+, it is higher when the person receiving care is a man; at 85–89 it is 0.740 for men and 0.211 for women (3.51 times), and at 90+ 0.381 for men and 0.016 for women (Section 6).
Sixth, what separates them is whether the caregiver is a spouse or a child. "The caregiver is also old" bundles into one number a shift, by age of the person receiving care, from spouse to child.
Scope note: This paper claims no new mathematical theorem and no new law — the numbers of caregivers are in public tables, and this paper only lined them up and compared them. This paper is a structural interpretation of the shape of numbers in public aggregate data; it is not medical advice, not a diagnosis, and not a treatment recommendation. The author is not a physician. Decisions about individual health should be discussed with a physician or a medical institution. This is a preprint that has not been peer reviewed. It does not judge family caregivers. It does not discuss who should provide care or how care should be shared. The Comprehensive Survey of Living Conditions is a sample survey, the numbers are estimates, and the numbers in this paper are per 100,000, not counts of people. Cases where the main caregiver is a provider, other, or not stated are not included (notes to the table). The tables on worries, stress, and mental state in the same survey are not used. It is a comparison of age differences in one year (2025), not how the same family changes. Considering that family caregivers and people receiving care may read it, it is not written as an outlook for any one family. About the data: the Comprehensive Survey of Living Conditions (e-Stat) is used under the Government Standard Terms of Use (Version 2.0), and the shares and ratios in this paper were created by processing it. What this paper adds: lining up the share of co-resident family caregivers aged 65+ by age of the person receiving care, and showing that the pattern of high at 70–74, low at 85–89, and back up at 90+ coincides with the shift from spouse to child.
1. Notation and question
- Family caregiver: when the main caregiver is family or relatives (spouse, child, child-in-law, parent, or other relative).
- Per 100,000: the number when the total number of people needing care is set to 100,000.
- Share aged 65+: among co-resident main caregivers, the share whose main caregiver is 65+ (by age of the person receiving care).
- Share by relationship: among co-resident main caregivers, the share who are a spouse, child, or child-in-law (by sex and age of the person receiving care).
Question: How does the share of family caregivers who are old change with the age of the person receiving care? And is the caregiver then a spouse or a child?
Observation 1.1: M058 showed how fast the share certified as needing care doubles with age. M059 showed that the causes for needing care shift with age. This paper looks at the age and relationship of those providing care.
2. Survey and design
To be honest: the design was decided after seeing the tables.
| Content | |
|---|---|
| Tables | 2025 Comprehensive Survey of Living Conditions (long-term care questionnaire), Table 60 (relationship × co-residence × sex × caregiver age), Table 61 (sex and age of the person receiving care × co-residence × caregiver sex and age), Table 81 (co-resident, sex and age of the person receiving care × relationship), and Table 82 (co-resident, care level × care time) |
| Noticed in the survey | The share of caregivers aged 65+ did not simply rise with the age of the person receiving care; it fell at 85–89 and returned at 90+ |
| Co-residence | The table of age of the person receiving care × relationship (Table 81) is for co-resident caregivers only, so age comparisons are aligned to co-resident caregivers |
| Measures | Share by relationship, share of caregivers aged 65+ and 75+, share whose care time is "almost all day" |
3. Data and checks
Calculation 3.1 The 4 retrieved files were fixed by SHA-256, and the following was checked.
- The titles are Tables 060, 061, 081, and 082, and all four are "per 100,000 people needing care." The notes to Tables 60 and 61 say "cases where the main caregiver's relationship is a provider, other, or not stated are not included."
- The rounding differences between the sum over relationships and the total in Table 60 and Table 81, and between the sum over care time and the total in Table 82, are all at most 1.
- The co-resident total and the co-resident numbers by age of the person receiving care agree between Tables 61 and 81 in all 8 columns, and the co-resident total (46,061) is the same in Tables 60 and 82.
4. Relationship and age of family caregivers
Calculation 4.1 Share by caregiver age, and spouses and children within it (co-resident and separate combined)
| Caregiver age | Share | Of which spouse | Of which child |
|---|---|---|---|
| 39 or under | 0.013 | 0.000 | 0.581 |
| 40–49 | 0.040 | 0.005 | 0.765 |
| 50–59 | 0.205 | 0.050 | 0.821 |
| 60–69 | 0.344 | 0.147 | 0.700 |
| 70–79 | 0.231 | 0.726 | 0.189 |
| 80+ | 0.157 | 0.974 | 0.005 |
Observation 4.2: When family is the main caregiver, 0.383 are spouses, 0.498 children, and 0.080 children-in-law, and 0.732 of caregivers are 60+ and 0.388 are 70+. The relationship is clearly divided by caregiver age: at 80+, 0.974 are spouses; at 50–59, 0.821 are children. Caregivers in their 50s and 60s are mainly children, and those 70+ are mainly spouses.
5. Core — the caregiver changes with the age of the person receiving care
Calculation 5.1 Co-resident family caregivers by age of the person receiving care
| Age receiving care | Spouse | Child | Child-in-law | Caregiver 65+ | Caregiver 75+ |
|---|---|---|---|---|---|
| 65–69 | 0.855 | 0.069 | 0.006 | 0.668 | 0.034 |
| 70–74 | 0.857 | 0.111 | 0.010 | 0.836 | 0.307 |
| 75–79 | 0.790 | 0.150 | 0.027 | 0.798 | 0.519 |
| 80–84 | 0.610 | 0.327 | 0.048 | 0.612 | 0.535 |
| 85–89 | 0.420 | 0.489 | 0.080 | 0.473 | 0.406 |
| 90+ | 0.122 | 0.641 | 0.209 | 0.594 | 0.144 |
Observation 5.2: The share of caregivers aged 65+ is high at 0.836 when the person receiving care is 70–74 and 0.798 at 75–79, falls to 0.473 at 85–89, and returns to 0.594 at 90+. Over the same span, the share of spouses falls from 0.857 to 0.122 and that of children rises from 0.111 to 0.641. Around 85–89 of the person receiving care, the caregiver shifts from spouse to child. The age of co-resident caregivers when the person receiving care is 85–89 is widely spread, with 0.234 at 50–59, 0.326 at 60–69, and 0.346 at 80+, while at 90+ those aged 60–69 make up 0.570. At 90+, children-in-law (0.209) also exceed spouses (0.122). The share where both are 65+ is 0.619, and both 75+ is 0.371.
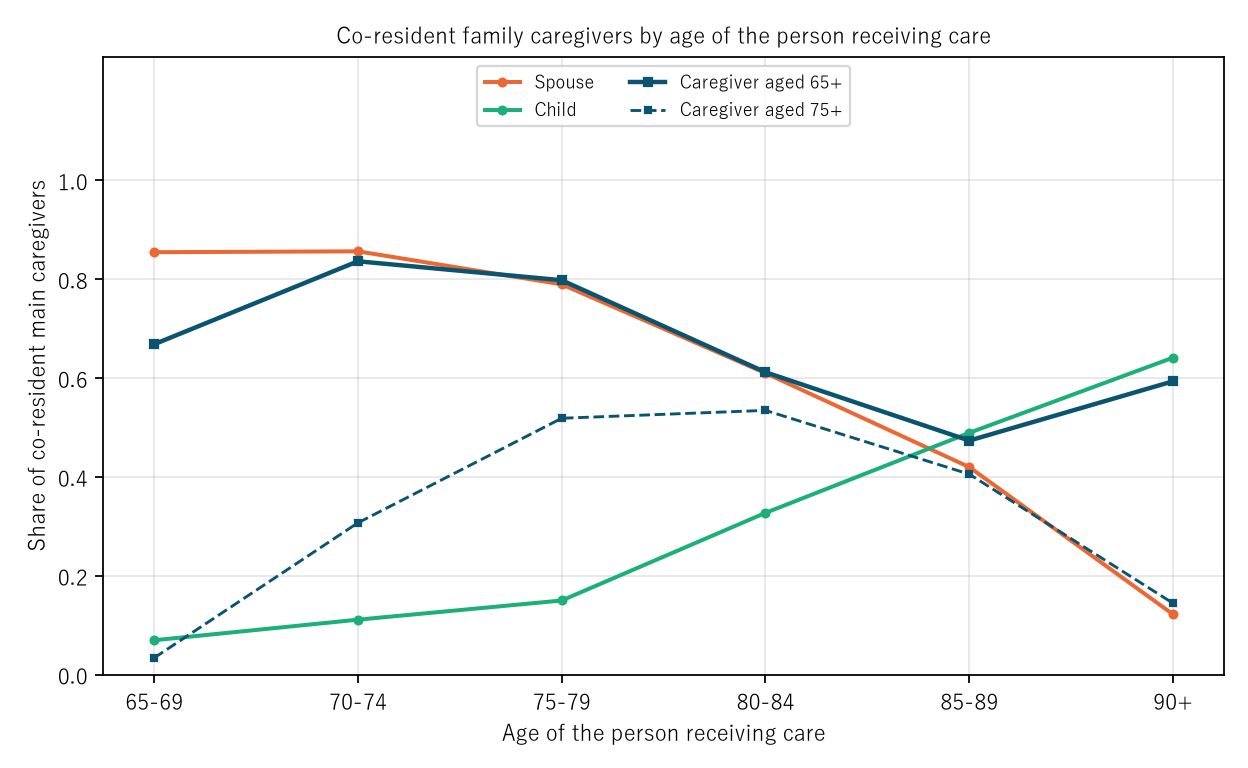
Figure 1: By age of the person receiving care, the share among co-resident main caregivers. Orange is spouse, green child, navy solid caregiver aged 65+, and navy dashed caregiver aged 75+.
6. By sex of the person receiving care
Calculation 6.1 Share cared for by a spouse (co-resident, by sex of the person receiving care)
| Age receiving care | Men receiving care | Women receiving care |
|---|---|---|
| 65–69 | 0.902 | 0.813 |
| 70–74 | 0.957 | 0.773 |
| 75–79 | 0.904 | 0.622 |
| 80–84 | 0.886 | 0.356 |
| 85–89 | 0.740 | 0.211 |
| 90+ | 0.381 | 0.016 |
Observation 6.2: At every age 65+, the share cared for by a spouse is higher when the person receiving care is a man. For men, 0.886 or more are cared for by a spouse up to 80–84, and 0.740 even at 85–89. For women, it falls from 0.622 at 75–79 to 0.211 at 85–89 and 0.016 at 90+. At 85–89, men's share is 3.51 times women's.
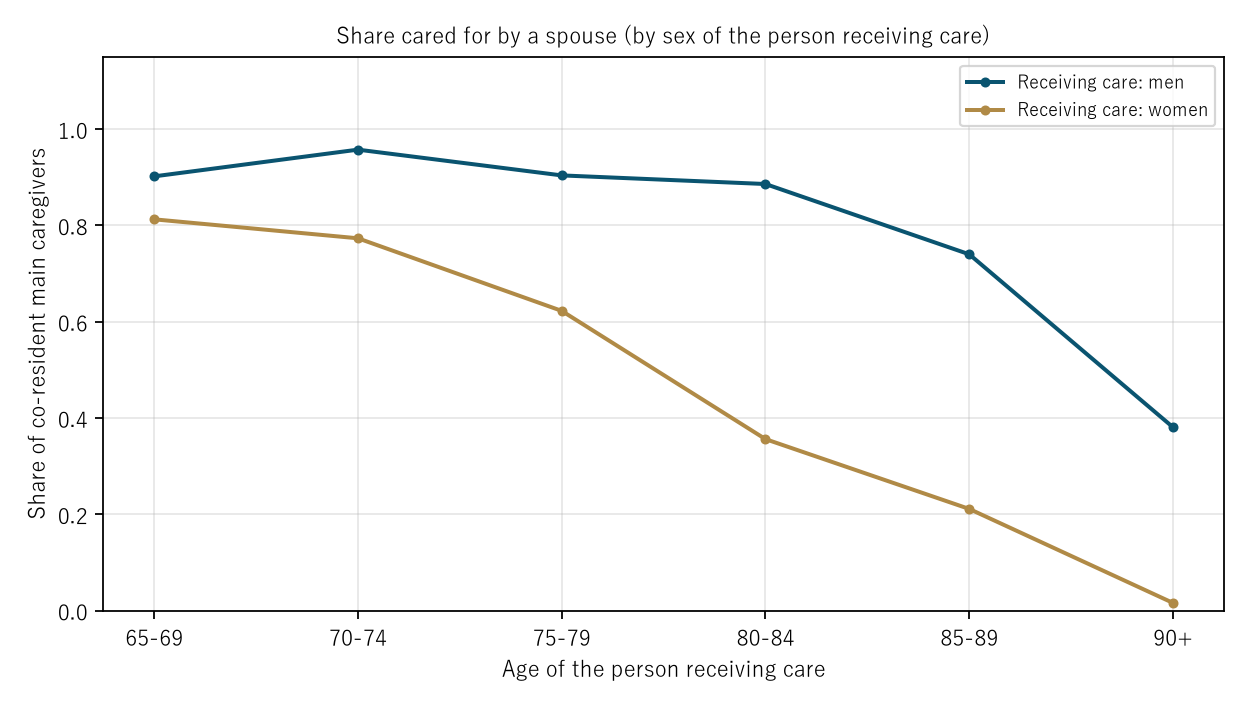
Figure 2: Share cared for by a spouse (co-resident). Navy is men receiving care, and gold women.
7. Care level and care time
Calculation 7.1 Care time of co-resident main caregivers (by care level)
| Care level | Almost all day | Help only when needed |
|---|---|---|
| Support levels (total) | 0.048 | 0.636 |
| Care level 1 | 0.106 | 0.577 |
| Care level 2 | 0.151 | 0.491 |
| Care level 3 | 0.295 | 0.263 |
| Care level 4 | 0.485 | 0.151 |
| Care level 5 | 0.542 | 0.112 |
Observation 7.2: The share whose care time is "almost all day" is 0.048 at the support levels and 0.106 at care level 1, and grows with heavier levels to 0.542 at care level 5. "Helping only when needed" moves the opposite way, from 0.636 at the support levels to 0.112 at care level 5.
8. Limitations
- The Comprehensive Survey of Living Conditions is a sample survey; the numbers are estimates. The numbers in this paper are per 100,000, not counts of people.
- Cases where the main caregiver is a provider, other, or not stated are not included. Care for people living in facilities is outside these tables.
- It is a comparison of age differences in one year (2025), not how the same family changes.
- It does not judge family caregivers or discuss who should provide care. The tables on worries, stress, and mental state are not used. Prefectures are not compared.
Conclusion
The share of co-resident family caregivers aged 65+ was 0.836 when the person receiving care was 70–74, fell to 0.473 at 85–89, and returned to 0.594 at 90+. Over that span, the caregiver shifted from spouse (0.857 → 0.122) to child (0.111 → 0.641), and at 90+, 0.570 of caregivers were aged 60–69. When the person receiving care was 85–89, the share cared for by a spouse was 0.740 for men and 0.211 for women.
One thing separates them — whether the caregiver is a spouse or a child.
On hearing "the caregivers are also old," check together how old the person receiving care is and whether the caregiver is a spouse or a child.
Data and reproduction
| Data | 2025 Comprehensive Survey of Living Conditions (long-term care questionnaire), Tables 60, 61, 81, and 82 (Ministry of Health, Labour and Welfare; e-Stat) (retrieved 26 September 2026) |
| Terms of use | e-Stat follows the Government Standard Terms of Use (Version 2.0). The shares and ratios in this paper were created by processing it and are not figures produced by the government |
| Scope | Japan, 2025 |
| Checker | 検算/M060.py (--zu also draws the figures). Every number in the text is taken from 検算/M060_output.txt |
| Raw data | The 4 retrieved files and SOURCES.md in data/ (URLs, retrieval date, SHA-256, terms of use, definitions and how calculations are set up) |
| Figures | 図/M060_zu1, 図/M060_zu2 (png, svg, English versions) |
References
- Ministry of Health, Labour and Welfare. 2025 Comprehensive Survey of Living Conditions, long-term care, Tables 60, 61, 81, and 82 (in Japanese). e-Stat (accessed 26 September 2026). https://www.e-stat.go.jp/
- Yamagishi, Y. (2026). The Share Certified as Needing Care Doubles Every 4.26–4.97 Years at Ages 65–84, Faster Than the Death Rate at the Same Ages (5.87–7.90 Years) — The Slowdown from 85 Is in the Support Levels, and Counting Only Care Levels 3–5 It Keeps Doubling Every 4.64–5.61 Years up to 90–94 [M058]. Zenodo. https://doi.org/10.5281/zenodo.22975817
- Yamagishi, Y. (2026). The Leading Main Cause for Needing Care Is Dementia (16,743 per 100,000), but Choosing All That Apply It Is Frailty Due to Old Age (26,100) — By Age It Shifts from Cerebrovascular Disease (65–79) to Dementia (80–89) to Frailty (90+), and for Women the Top Three Are Within 98 [M059]. Zenodo. https://doi.org/10.5281/zenodo.22975921
Reference
Yamagishi, Y. (2026). The Share of Co-resident Family Caregivers Aged 65+ Is 0.836 When the Person Receiving Care Is 70–74, Falls to 0.473 at 85–89, and Returns to 0.594 at 90+ [M060]. Zenodo.
DOI: 10.5281/zenodo.22976041
YOI: https://www.yamagishiyuuki.com/yoi/M060
ORCID: 0009-0006-8587-3450
PDF (English) · PDF (Japanese) · Date proof of the English PDF (OpenTimestamps .ots) · SHA256SUMS
The record page for this paper (in Japanese, with the PDFs in each language and the date proof): YOI M060. This paper is a preprint and has not been peer reviewed.