Abstract
Life expectancy at 65 and 75 from the 2024 abridged life table was divided by the Sullivan method into healthy and unhealthy years under three ways of counting "healthy" — (1) no limitation in daily life (Comprehensive Survey of Living Conditions 2025), (2) self-rated healthy (same), and (3) not at care levels 2–5 (Survey of Long-term Care Benefit Expenditures, July 2025, with the Population Estimates). It claims no new mathematical theorem and no new law.
First, the tables are consistent. In the two survey tables, the sums over categories, ages, and sexes match the totals within the rounding width (at most 3 thousand), and the totals of the two tables are the same. The life table's Σ nLx ÷ lx agrees with the table's life expectancy within 0.0034 years (Section 3).
Second, at every age 65+, the share with a limitation in daily life is larger than the share not self-rated healthy, and the share at care levels 2–5 is much smaller. At 85+, the share with a limitation is 0.452 for men and 0.517 for women, and the share not self-rated healthy is 0.338–0.339 for both (Section 4).
Third, this is the core of the paper. Of life expectancy at 65 (19.47 years for men, 24.38 for women), the unhealthy years are 4.97 for men and 7.22 for women under (1), 4.05 and 5.35 under (2), and 1.58 and 3.26 under (3). (1) is 3.15 times (3) for men and 2.21 times for women. The spread of the three healthy-year figures is 3.39 years for men and 3.96 for women (Section 5).
Fourth, women have longer life expectancy than men and longer unhealthy years under every way of counting. The share of healthy years in life expectancy is 0.745–0.919 for men and 0.704–0.866 for women, smaller for women under every way of counting (Section 5).
Fifth, extending "needing care" in (3) to include the support levels (any certification) lengthens the unhealthy years to 3.10 years for men and 6.29 for women. For women at 75, the healthy years counted by any certification (9.41 years) fall below (1) (9.76 years) (Section 6).
Sixth, what separates them is what is counted as "healthy". "Healthy years" are not one number; the choice of how to count moves them by more than 3 years even for men.
Scope note: This paper claims no new mathematical theorem and no new law — the Sullivan method of dividing life expectancy into healthy and unhealthy years is long established, and this paper only applied it to three ways of counting. This paper is a structural interpretation of the shape of numbers in public aggregate data; it is not medical advice, not a diagnosis, and not a treatment recommendation. The author is not a physician. Decisions about individual health should be discussed with a physician or a medical institution. This is a preprint that has not been peer reviewed. It does not recompute the published healthy life expectancy (the year, data, details of definitions, and calculation differ). It does not go into ways to extend health. (1) and (2) are survey answers and, as the table's note says, do not include people in hospital. The certification in (3) is the number of people who applied and were certified, not the number of people who need care itself (M058). Life expectancy is a period value built from that year's age-specific death rates, not the years anyone actually lives (M003). It is not an outlook for any one person. About the data: the Comprehensive Survey of Living Conditions, the abridged life table, the Survey of Long-term Care Benefit Expenditures, and the Population Estimates (e-Stat) are used under the Government Standard Terms of Use (Version 2.0), and the years and shares in this paper were created by processing them. What this paper adds: dividing the same life expectancy by three ways of counting "healthy," and showing that the unhealthy years differ about threefold, that the order of the three is the same for every sex and age, and that extending "needing care" to the support levels changes the order in one place.
1. Notation and question
- Three kinds of "healthy": (1) no limitation in daily life, (2) self-rated healthy (health rated "good," "fairly good," or "fair"), (3) not at care levels 2–5. As another version of (3), "no certification" (none of support level 1 to care level 5) is also shown.
- Share not healthy: (1) "with a limitation in daily life" ÷ (total − not stated); (2) "not so good" and "poor" ÷ (total − not stated); (3) number certified at care levels 2–5 ÷ total population.
- Healthy years (Sullivan method): Σ (person-years nLx at each age × the healthy share at that age) ÷ survivors lx. The share for a 5-year group is applied to each age in the group (85+ as one group for (1)(2), 95+ for (3)).
- Unhealthy years: life expectancy − healthy years.
Question: How much do "healthy years" move depending on what is counted as healthy?
Observation 1.1: M003 showed that life expectancy is a period value built from the same year's age-specific rates, not the years anyone actually lives. M058 showed that the age gradient of the certification rate changes with which levels are counted. This paper divides the same life expectancy in three ways.
2. Survey and design
To be honest: the design was decided after seeing the tables.
| Content | |
|---|---|
| Tables | 2025 Comprehensive Survey of Living Conditions, health questionnaire, Table 7 (limitation in daily life × sex × 5-year age) and Table 8 (self-rated health × sex × 5-year age); 2024 abridged life table (men, women); Survey of Long-term Care Benefit Expenditures for August 2025 review, Table 19, and Population Estimates as of 1 July 2025 (same as M058) |
| Year gap | The life table is for 2024, and the survey and certification for 2025: one year apart |
| Age bands | The survey's top group is 85+, and certification's is 95+. The same share was applied to each older age |
| Measures | Healthy and unhealthy years within life expectancy at 65 and 75, and their share of life expectancy |
3. Data and checks
Calculation 3.1 The 6 retrieved files were fixed by SHA-256, and the following was checked.
- Table 7 is "Table 007: household members (aged 6+) by presence of limitation in daily life, the matters limited (multiple answers), sex, and age (5-year groups)," and Table 8 is "Table 008: household members (aged 6+) by self-rated health, sex, and age (5-year groups)." The unit is thousands, and the note says "household members do not include people in hospital."
- The rounding differences are at most 1 between affected + unaffected + not stated and the total in Table 7, at most 2 between the five levels + not stated and the total in Table 8, at most 3 between the sum over ages and the total, and at most 1 between men + women and the total (thousands). The totals of the two tables are the same by sex and age.
- The life table's Σ nLx ÷ lx agrees with the table's life expectancy with a difference of at most 0.0034 years (men and women × ages 65 and 75).
- The certified counts and population are the same files as M058.
4. Share not healthy by age
Calculation 4.1 (1) With a limitation in daily life and (2) not self-rated healthy (ages 65+)
| Age | Men (1) | Men (2) | Women (1) | Women (2) |
|---|---|---|---|---|
| 65–69 | 0.152 | 0.131 | 0.157 | 0.133 |
| 70–74 | 0.198 | 0.168 | 0.182 | 0.145 |
| 75–79 | 0.235 | 0.201 | 0.237 | 0.194 |
| 80–84 | 0.319 | 0.258 | 0.331 | 0.259 |
| 85+ | 0.452 | 0.338 | 0.517 | 0.339 |
Calculation 4.2 (3) Care levels 2–5 and any certification (support level 1 to care level 5)
| Age | Men care 2–5 | Men any certification | Women care 2–5 | Women any certification |
|---|---|---|---|---|
| 65–69 | 0.018 | 0.033 | 0.012 | 0.025 |
| 70–74 | 0.033 | 0.061 | 0.025 | 0.055 |
| 75–79 | 0.057 | 0.110 | 0.052 | 0.125 |
| 80–84 | 0.104 | 0.218 | 0.123 | 0.301 |
| 85–89 | 0.188 | 0.394 | 0.256 | 0.545 |
| 90–94 | 0.314 | 0.607 | 0.446 | 0.761 |
| 95+ | 0.470 | 0.770 | 0.679 | 0.909 |
Observation 4.3: For both sexes, at every age 65+, share (1) is larger than share (2). At 85+, (1) is 0.452 for men and 0.517 for women, and (2) is 0.338 for men and 0.339 for women. Care levels 2–5 in (3) are small even at 80–84 (0.104 for men, 0.123 for women), but at 95+ they are 0.470 for men and 0.679 for women.
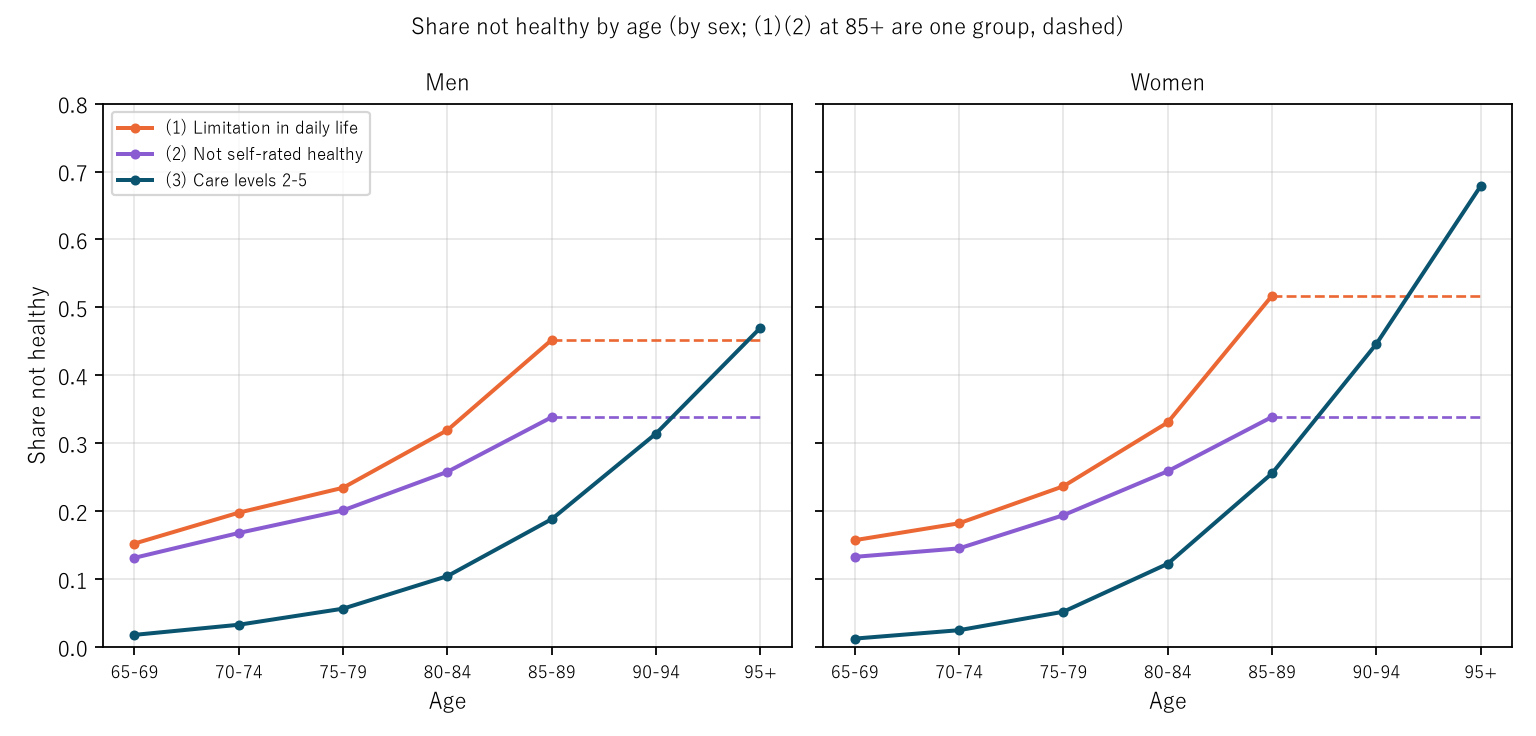
Figure 2: Share not healthy by age (men left, women right). Orange is (1) limitation in daily life, purple (2) not self-rated healthy, and navy (3) care levels 2–5. For (1) and (2), 85+ is one group, shown dashed.
5. Core — unhealthy years differ about threefold with how they are counted
Calculation 5.1 Healthy years within life expectancy (unhealthy years in parentheses)
| Life expectancy | (1) No limitation | (2) Self-rated healthy | (3) Not care 2–5 | No certification | |
|---|---|---|---|---|---|
| Men, 65 | 19.47 | 14.50 (4.97) | 15.42 (4.05) | 17.89 (1.58) | 16.36 (3.10) |
| Men, 75 | 12.08 | 8.10 (3.98) | 8.92 (3.16) | 10.48 (1.60) | 8.90 (3.18) |
| Women, 65 | 24.38 | 17.16 (7.22) | 19.03 (5.35) | 21.12 (3.26) | 18.09 (6.29) |
| Women, 75 | 15.75 | 9.76 (5.99) | 11.46 (4.29) | 12.44 (3.31) | 9.41 (6.34) |
Observation 5.2: Unhealthy years from 65 are (1) 4.97, (2) 4.05, and (3) 1.58 for men, and (1) 7.22, (2) 5.35, and (3) 3.26 for women. (1) is 3.15 times (3) for men and 2.21 times for women. For both sexes, healthy years are in the order (3) > (2) > (1), with a spread of 3.39 years for men and 3.96 for women. The share of healthy years in life expectancy is (1) 0.745, (2) 0.792, and (3) 0.919 for men and (1) 0.704, (2) 0.781, and (3) 0.866 for women, smaller for women under every way of counting. Women have longer life expectancy and longer unhealthy years under every one of (1), (2), and (3).
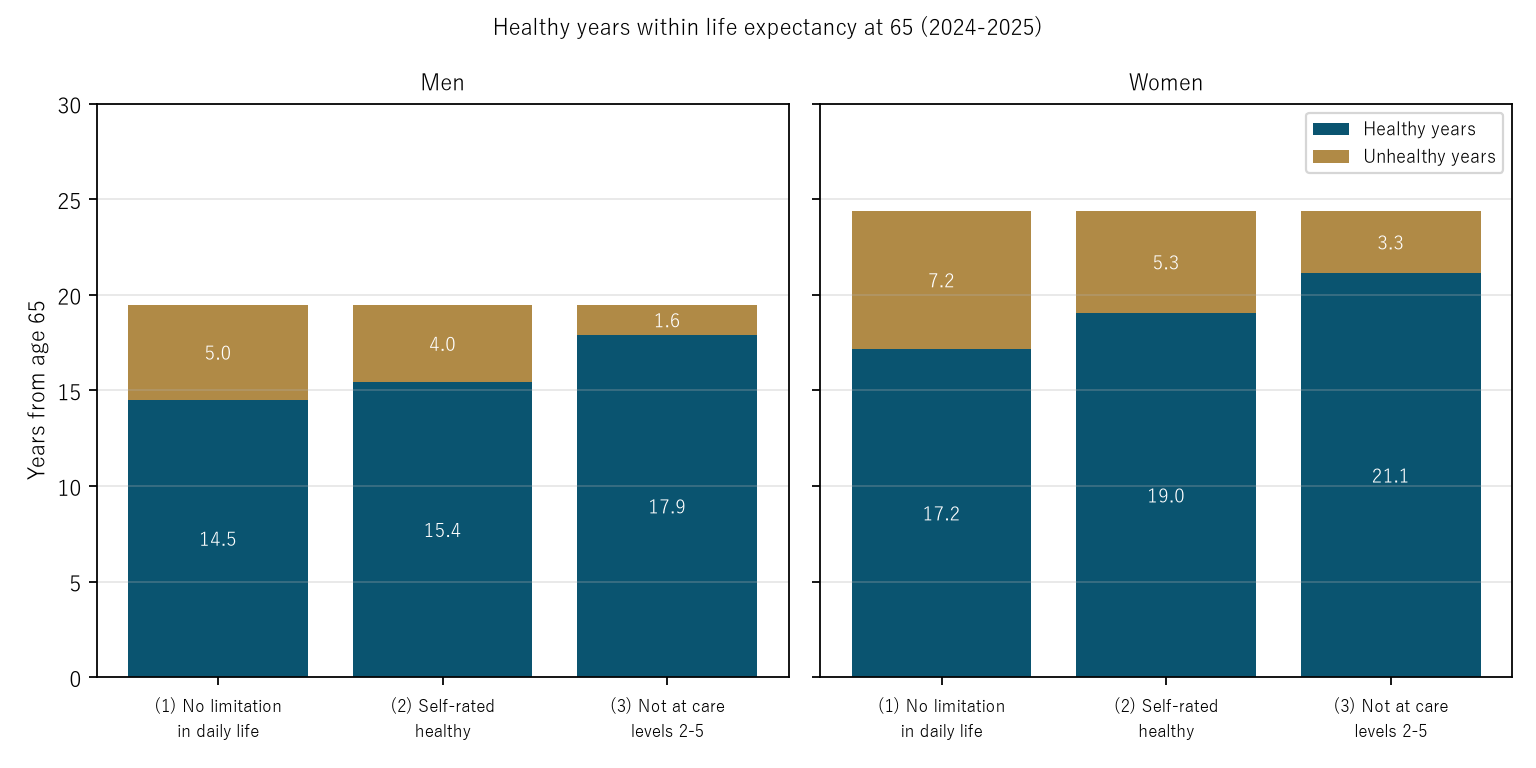
Figure 1: Healthy years (navy) and unhealthy years (gold) within life expectancy at 65. Men left, women right. The three bars are (1) no limitation in daily life, (2) self-rated healthy, and (3) not at care levels 2–5.
6. How far to extend "needing care"
Observation 6.1: Extending "needing care" in (3) to the support levels and counting any certification lengthens the unhealthy years from 65 from 1.58 to 3.10 years for men and from 3.26 to 6.29 for women. For women at 75, the healthy years counted by any certification (9.41 years) fall below the years with no limitation in daily life under (1) (9.76 years), and the order of the three changes. Of the four (men and women × 65 and 75), this happens only for women at 75. Even for the same "years not needing care," which levels are counted changes how it lines up against the other two ways of counting.
7. Limitations
- These do not equal the published healthy life expectancy (the year, data, details of definitions, and calculation differ). This paper looks at how much the years move when the definition changes; it does not recompute the published values.
- (1) and (2) are survey answers and do not include people in hospital. (3) is the number who applied and were certified, with the total population as the denominator. The three also differ in how the denominator is taken.
- The life table is for 2024, and the survey and certification for 2025. For each age at 85+ ((1)(2)) and 95+ ((3)), the share of the one group was applied.
- It does not go into ways to extend health. Prefectures are not compared. It is not an outlook for any one person.
Conclusion
Of life expectancy at 65, the unhealthy years were 4.97 for men and 7.22 for women counted by limitation in daily life, 4.05 and 5.35 counted by self-rated health, and 1.58 and 3.26 counted by care levels 2–5. The order of the three was the same for both sexes, and the spread exceeded 3 years. Extending "needing care" to the support levels changed the order for women at 75.
One thing separates them — what is counted as "healthy."
On hearing "healthy years" or "healthy life expectancy," check together what was counted as healthy, and what share of life expectancy it takes.
Data and reproduction
| Data | 2025 Comprehensive Survey of Living Conditions, health, Tables 7 and 8; 2024 abridged life table (men, women); Survey of Long-term Care Benefit Expenditures, monthly report for August 2025 review, Table 19 (all Ministry of Health, Labour and Welfare); Population Estimates as of 1 July 2025 (final figures) (Statistics Bureau, Ministry of Internal Affairs and Communications) (all from e-Stat; retrieved 26 September 2026) |
| Terms of use | e-Stat follows the Government Standard Terms of Use (Version 2.0). The years and shares in this paper were created by processing these and are not figures produced by the government |
| Scope | Japan, 2024–2025 |
| Checker | 検算/M061.py (--zu also draws the figures). Every number in the text is taken from 検算/M061_output.txt |
| Raw data | The 6 retrieved files and SOURCES.md in data/ (URLs, retrieval date, SHA-256, terms of use, definitions and how calculations are set up) |
| Figures | 図/M061_zu1, 図/M061_zu2 (png, svg, English versions) |
References
- Ministry of Health, Labour and Welfare. Survey of Long-term Care Benefit Expenditures, monthly report for August 2025 review, Table 19 (in Japanese). e-Stat (accessed 26 September 2026). https://www.e-stat.go.jp/
- Ministry of Health, Labour and Welfare. Abridged Life Table 2024, Tables 1 and 2 (in Japanese). e-Stat (accessed 26 September 2026). https://www.e-stat.go.jp/
- Ministry of Health, Labour and Welfare. 2025 Comprehensive Survey of Living Conditions, health, Tables 7 and 8 (in Japanese). e-Stat (accessed 26 September 2026). https://www.e-stat.go.jp/
- Statistics Bureau, Ministry of Internal Affairs and Communications. Population Estimates, population as of the 1st of each month, Table 1, population by age (5-year groups) and sex (final figures for July 2025, provisional for December 2025) (in Japanese). e-Stat (accessed 26 September 2026). https://www.e-stat.go.jp/
- Yamagishi, Y. (2026). Life Expectancy Is Not the Number of Years Anyone Actually Lives [M003]. Zenodo. https://doi.org/10.5281/zenodo.22963485
- Yamagishi, Y. (2026). The Share Certified as Needing Care Doubles Every 4.26–4.97 Years at Ages 65–84, Faster Than the Death Rate at the Same Ages (5.87–7.90 Years) — The Slowdown from 85 Is in the Support Levels, and Counting Only Care Levels 3–5 It Keeps Doubling Every 4.64–5.61 Years up to 90–94 [M058]. Zenodo. https://doi.org/10.5281/zenodo.22975817
Reference
Yamagishi, Y. (2026). The "Unhealthy Years" Within Life Expectancy at 65 Differ About Threefold with What Counts as Healthy [M061]. Zenodo.
DOI: 10.5281/zenodo.22976414
YOI: https://www.yamagishiyuuki.com/yoi/M061
ORCID: 0009-0006-8587-3450
PDF (English) · PDF (Japanese) · Date proof of the English PDF (OpenTimestamps .ots) · SHA256SUMS
The record page for this paper (in Japanese, with the PDFs in each language and the date proof): YOI M061. This paper is a preprint and has not been peer reviewed.