Abstract
Using the 2025 Comprehensive Survey of Living Conditions (long-term care questionnaire), the causes for needing care were lined up by sex and age in two tables: the main cause (one) and causes (multiple answers). The numbers are "per 100,000 people needing care" (the total number of people needing care set to 100,000). It claims no new mathematical theorem and no new law.
First, the tables are consistent. The sums of main causes, sexes, and ages match the totals within the rounding width (at most 3), the sum of multiple answers is at least the total in every cell, and the total per cause in the table by care level agrees with the main-cause table (Section 3).
Second, for both sexes the leading cause is dementia (16,743) as the main cause, and frailty due to old age (26,100) in multiple answers. For men, cerebrovascular disease leads in both (6,737 and 8,997). For women, the main causes are frailty 11,821, fracture or fall 11,739, and dementia 11,723, with only 98 between first and third (0.0015 of the women's total) (Section 4).
Third, this is the core of the paper. The leading main cause shifts with age. For both sexes, it is cerebrovascular disease at 65–79 (0.231 at 75–79), dementia at 80–89 (0.224 at 85–89), and frailty due to old age at 90+ (0.298). The share of frailty rises with age from 0.019 at 65–69 to 0.298 at 90+, and cerebrovascular disease falls from 75–79. In multiple answers, the order of the shift is the same (Section 5).
Fourth, multiple answers ÷ main cause ranges from 1.25 to 3.50 by cause. Visual or hearing impairment 3.50, diabetes 3.12, respiratory disease 2.61, and heart disease 2.53 are often named but rarely become the main cause. Parkinson's disease 1.25, cerebrovascular disease 1.33, and dementia 1.35 are almost always the main cause when named (Section 6).
Fifth, the composition by care level also differs by main cause. Those whose main cause is dementia have a small share at the support levels, 0.126, while joint disease has 0.600 and visual or hearing impairment 0.592 (Section 7).
Sixth, what separates them is whether one cause is chosen or all that apply. "The leading cause for needing care" changes with how causes are chosen, with age, and with sex.
Scope note: This paper claims no new mathematical theorem and no new law — the numbers of causes are in public tables, and this paper only lined them up and compared them. This paper is a structural interpretation of the shape of numbers in public aggregate data; it is not medical advice, not a diagnosis, and not a treatment recommendation. The author is not a physician. Decisions about individual health should be discussed with a physician or a medical institution. This is a preprint that has not been peer reviewed. It does not go into ways to reduce or prevent the causes. The Comprehensive Survey of Living Conditions is a sample survey, and the numbers are estimates. The numbers in this paper are per 100,000 and not counts of people, and ranks with small differences (such as women's top three) may be within the survey's variation. The causes are the survey answers (one main cause, or all that apply for multiple answers), not medical diagnostic records. Considering that family caregivers and people receiving care may read it, it is not written as an outlook for any one person. About the data: the Comprehensive Survey of Living Conditions (e-Stat) is used under the Government Standard Terms of Use (Version 2.0), and the shares and ratios in this paper were created by processing it. What this paper adds: lining up the causes for needing care in the two tables of main cause and multiple answers, and showing that the leading cause changes from dementia to frailty depending on how causes are chosen, that it shifts with age from cerebrovascular disease to dementia to frailty, and that some causes are often named but rarely become the main cause.
1. Notation and question
- Main cause: Table 23. The main cause for needing care, answered as one.
- Multiple answers: Table 25. All applicable causes.
- Per 100,000: the number when the total number of people needing care is set to 100,000.
- Share: for each sex and age cell, the number for a cause ÷ the total of that cell.
- Rank: the rank among 12 causes, excluding other, don't know, and not stated.
- Multiple answers ÷ main cause: for the same cause, the number in multiple answers ÷ the number as main cause (both sexes).
Question: How does "the leading cause for needing care" change depending on whether one cause or all are chosen, on age, and on sex?
Observation 1.1: M045 showed that the number of "people with diabetes" changes by orders of magnitude with what is counted. M058 showed that the age gradient of the share certified as needing care changes with which levels are counted. This paper lines up two ways of counting the causes of needing care.
2. Survey and design
To be honest: the design was decided after seeing the tables.
| Content | |
|---|---|
| Tables | 2025 Comprehensive Survey of Living Conditions (long-term care questionnaire), Table 23 (main cause × outpatient visits × sex × age group), Table 25 (causes, multiple answers × same categories), and Table 24 (care level × main cause) |
| Noticed in the survey | The numbers are not counts but "per 100,000 people needing care," so comparisons use shares within cells and the ratio between the two tables for the same cause |
| Outpatient visits | Only the total category is used |
| Measures | The leading cause, shares by age, multiple answers ÷ main cause, and the composition by care level |
3. Data and checks
Calculation 3.1 The 3 retrieved files were fixed by SHA-256, and the following was checked.
- The titles are "Table 023: number of people needing care by main cause for needing care, outpatient visits, sex, and age group," "Table 025 … causes for needing care (multiple answers) …," and "Table 024: number of people needing care by current care level and main cause." All three are "per 100,000 people needing care."
- The cause headings are the total and 15 categories, the same in Tables 23 and 25. The total row is 100,000.
- The rounding differences are at most 3 between the sum of main causes and the total, at most 1 between men + women and the total, and at most 2 between the sum over ages and the total. The sum of multiple answers is at least the total in every cell.
- The total per cause in Table 24 agrees with the total row of Table 23 in all 15 categories.
4. The leader overall and by sex
Calculation 4.1 Top 5 causes (per 100,000)
| Main cause (one) | Multiple answers | |
|---|---|---|
| Both sexes | Dementia 16,743; Frailty due to old age 15,586; Fracture or fall 14,638; Cerebrovascular disease 12,496; Joint disease 9,134 | Frailty due to old age 26,100; Dementia 22,539; Fracture or fall 22,517; Cerebrovascular disease 16,653; Joint disease 16,350 |
| Men | Cerebrovascular disease 6,737; Dementia 5,021; Frailty due to old age 3,766; Fracture or fall 2,899; Heart disease 1,963 | Cerebrovascular disease 8,997; Dementia 6,896; Frailty due to old age 6,790; Heart disease 5,020; Fracture or fall 4,857 |
| Women | Frailty due to old age 11,821; Fracture or fall 11,739; Dementia 11,723; Joint disease 7,453; Cerebrovascular disease 5,758 | Frailty due to old age 19,310; Fracture or fall 17,660; Dementia 15,643; Joint disease 12,901; Cerebrovascular disease 7,656 |
Observation 4.2: For both sexes, the leader is dementia (16,743) as the main cause and frailty due to old age (26,100) in multiple answers; the leader changes with how causes are chosen. For men, cerebrovascular disease leads in both. For women, the main causes are frailty 11,821, fracture or fall 11,739, and dementia 11,723, with 98 between first and third (0.0015 of the women's total of 65,762). The order of these three may be within the variation of the sample survey.
5. Core — the leader shifts with age
Calculation 5.1 Share of main causes by age (both sexes)
| Age | Cerebrovascular | Dementia | Frailty | Fracture or fall | Joint disease | Leader |
|---|---|---|---|---|---|---|
| 65–69 | 0.192 | 0.078 | 0.019 | 0.055 | 0.049 | Cerebrovascular disease |
| 70–74 | 0.216 | 0.073 | 0.036 | 0.113 | 0.059 | Cerebrovascular disease |
| 75–79 | 0.231 | 0.138 | 0.041 | 0.094 | 0.091 | Cerebrovascular disease |
| 80–84 | 0.129 | 0.178 | 0.098 | 0.145 | 0.138 | Dementia |
| 85–89 | 0.070 | 0.224 | 0.169 | 0.167 | 0.083 | Dementia |
| 90+ | 0.058 | 0.158 | 0.298 | 0.185 | 0.079 | Frailty due to old age |
Observation 5.2: For both sexes, the leading main cause is cerebrovascular disease at 65–79, dementia at 80–89, and frailty due to old age at 90+. The share of frailty rises with age from 0.019 at 65–69 to 0.298 at 90+, and cerebrovascular disease falls from 0.231 at 75–79 to 0.058 at 90+. For men, cerebrovascular disease leads up to 80–84, and dementia leads from 85–89. In multiple answers too, the order of the shift for both sexes (cerebrovascular disease → dementia → frailty) is the same, and at 90+ frailty is named by 0.485.
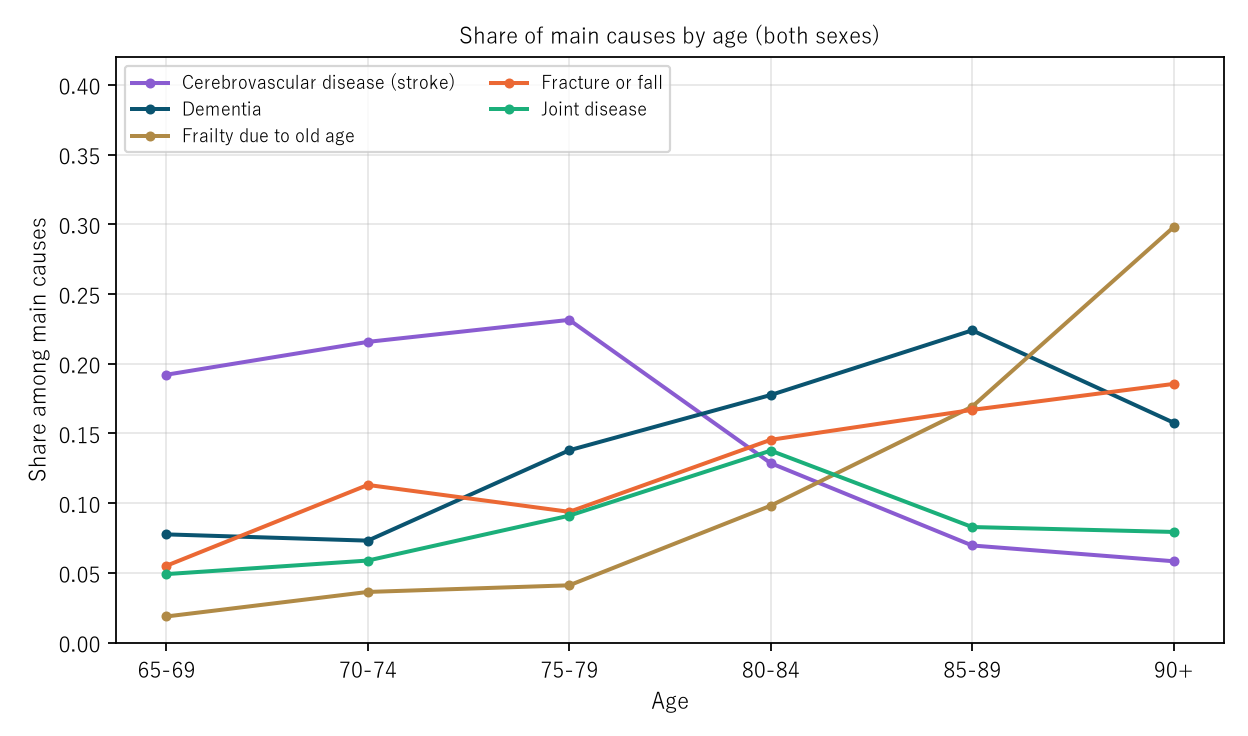
Figure 1: Share of main causes by age (both sexes). Purple is cerebrovascular disease, navy dementia, gold frailty due to old age, orange fracture or fall, and green joint disease.
6. Often named, but rarely the main cause
Calculation 6.1 Multiple answers ÷ main cause (both sexes, per 100,000)
| Cause | Main cause | Multiple answers | Multiple ÷ main |
|---|---|---|---|
| Visual or hearing impairment | 1,901 | 6,655 | 3.50 |
| Diabetes | 2,861 | 8,924 | 3.12 |
| Respiratory disease | 1,885 | 4,923 | 2.61 |
| Heart disease | 4,818 | 12,192 | 2.53 |
| Joint disease | 9,134 | 16,350 | 1.79 |
| Cancer | 2,992 | 5,190 | 1.73 |
| Frailty due to old age | 15,586 | 26,100 | 1.67 |
| Fracture or fall | 14,638 | 22,517 | 1.54 |
| Spinal cord injury | 1,744 | 2,399 | 1.38 |
| Dementia | 16,743 | 22,539 | 1.35 |
| Cerebrovascular disease | 12,496 | 16,653 | 1.33 |
| Parkinson's disease | 2,968 | 3,699 | 1.25 |
Observation 6.2: Visual or hearing impairment (3.50), diabetes (3.12), respiratory disease (2.61), and heart disease (2.53) are named more than 2.5 times as often in multiple answers as main causes. They are often named, but few people give them as the main cause. Conversely, Parkinson's disease (1.25), cerebrovascular disease (1.33), and dementia (1.35) are almost always the main cause when named. For every cause, multiple answers are at least the main cause.
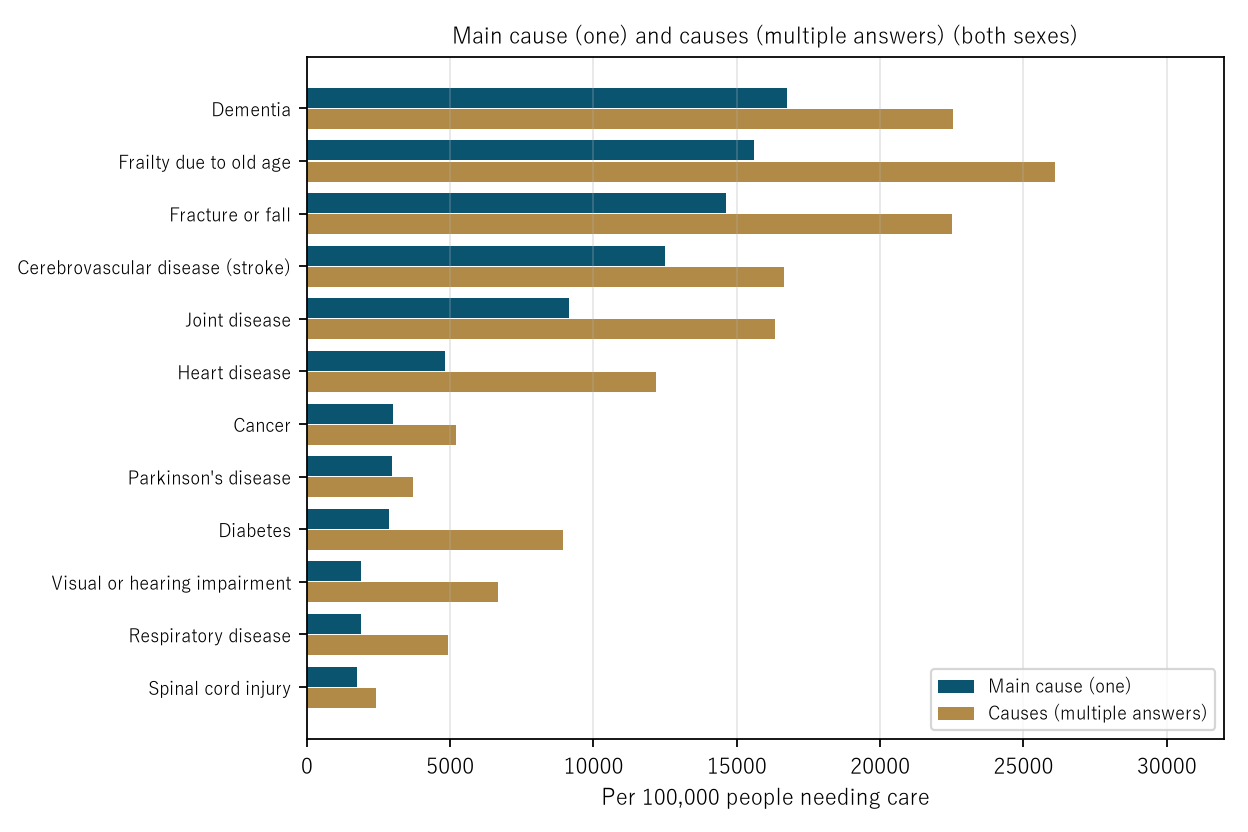
Figure 2: For each cause, the number as main cause (navy, one) and in multiple answers (gold) (both sexes, per 100,000 people needing care).
7. Care level by main cause
Calculation 7.1 Shares at the support levels and at care levels 3–5 by main cause (Table 24)
| Main cause | Support share | Care 3–5 share |
|---|---|---|
| Cerebrovascular disease | 0.278 | 0.353 |
| Heart disease | 0.422 | 0.228 |
| Cancer | 0.349 | 0.216 |
| Respiratory disease | 0.424 | 0.195 |
| Joint disease | 0.600 | 0.127 |
| Dementia | 0.126 | 0.308 |
| Parkinson's disease | 0.265 | 0.372 |
| Diabetes | 0.407 | 0.215 |
| Visual or hearing impairment | 0.592 | 0.065 |
| Fracture or fall | 0.372 | 0.216 |
| Spinal cord injury | 0.485 | 0.183 |
| Frailty due to old age | 0.422 | 0.125 |
Observation 7.2: Those whose main cause is dementia have a support-level share of 0.126, the smallest of the 12 causes. Joint disease (0.600) and visual or hearing impairment (0.592) have the largest support-level shares. The care 3–5 share is largest for Parkinson's disease (0.372) and cerebrovascular disease (0.353). Counting only care levels 3–5, the order of main causes becomes dementia, cerebrovascular disease, fracture or fall, and frailty due to old age, and frailty moves from 2nd over all levels to 4th. The order changing with which levels are counted is the same shape M058 saw in the certification rate.
8. Limitations
- The Comprehensive Survey of Living Conditions is a sample survey, and the numbers are estimates. The numbers in this paper are per 100,000 and not counts of people. Ranks with small differences may be within the variation.
- The causes are survey answers, not medical diagnostic records. What lies inside answers such as "frailty due to old age" or "don't know" cannot be seen in these tables.
- It is a comparison of age differences in one year (2025), not how the same people change.
- It does not go into ways to reduce or prevent the causes. Prefectures are not compared. It is not an outlook for any one person.
Conclusion
The leading cause for needing care was dementia as the main cause (one) and frailty due to old age in multiple answers. By age, it shifted from cerebrovascular disease at 65–79 to dementia at 80–89 and frailty at 90+, and for women the top three were within 98. Visual or hearing impairment, diabetes, respiratory disease, and heart disease were often named but rarely became the main cause.
One thing separates them — whether one cause is chosen or all that apply.
On hearing "the leading cause for needing care," check together whether it is the number for the main cause or for multiple answers, and for which age and sex.
Data and reproduction
| Data | 2025 Comprehensive Survey of Living Conditions (long-term care questionnaire), Tables 23, 25, and 24 (Ministry of Health, Labour and Welfare; e-Stat) (retrieved 26 September 2026) |
| Terms of use | e-Stat follows the Government Standard Terms of Use (Version 2.0). The shares and ratios in this paper were created by processing it and are not figures produced by the government |
| Scope | Japan, 2025 |
| Checker | 検算/M059.py (--zu also draws the figures). Every number in the text is taken from 検算/M059_output.txt |
| Raw data | The 3 retrieved files and SOURCES.md in data/ (URLs, retrieval date, SHA-256, terms of use, definitions and how calculations are set up) |
| Figures | 図/M059_zu1, 図/M059_zu2 (png, svg, English versions) |
References
- Ministry of Health, Labour and Welfare. 2025 Comprehensive Survey of Living Conditions, long-term care, Tables 23, 25, and 24 (in Japanese). e-Stat (accessed 26 September 2026). https://www.e-stat.go.jp/
- Yamagishi, Y. (2026). The Number of "People with Diabetes" Changes by Orders of Magnitude with What Is Counted — Per 100,000 at 70+, 19,500 Strongly Suspected by Test, 12,130 Visiting a Clinic, 449–1,948 in Care on the Survey Day, and 44.8 Deaths a Year; the Rise from 40–49 Also Ranges from 3.1-Fold to 29.4-Fold [M045]. Zenodo. https://doi.org/10.5281/zenodo.22974556
- Yamagishi, Y. (2026). The Share Certified as Needing Care Doubles Every 4.26–4.97 Years at Ages 65–84, Faster Than the Death Rate at the Same Ages (5.87–7.90 Years) — The Slowdown from 85 Is in the Support Levels, and Counting Only Care Levels 3–5 It Keeps Doubling Every 4.64–5.61 Years up to 90–94 [M058]. Zenodo. https://doi.org/10.5281/zenodo.22975817
Reference
Yamagishi, Y. (2026). The Leading Main Cause for Needing Care Is Dementia (16,743 per 100,000), but Choosing All That Apply It Is Frailty Due to Old Age (26,100) [M059]. Zenodo.
DOI: 10.5281/zenodo.22975921
YOI: https://www.yamagishiyuuki.com/yoi/M059
ORCID: 0009-0006-8587-3450
PDF (English) · PDF (Japanese) · Date proof of the English PDF (OpenTimestamps .ots) · SHA256SUMS
The record page for this paper (in Japanese, with the PDFs in each language and the date proof): YOI M059. This paper is a preprint and has not been peer reviewed.