Abstract
Using the Ministry of Health, Labour and Welfare's Survey of Medical Care Benefits (FY2023) — claim counts and points by point bracket (Table 5) and the table by disease chapter and point bracket (Table 6) — this paper looked at how far medical costs are concentrated in a small number of claims. No new mathematical theorem and no new law are claimed.
First, the tables are consistent. For inpatient, outpatient, dental, and pharmacy alike, the counts and points of the brackets sum to the totals, and in Table 6 both the brackets and the chapters sum to the totals (Section 3).
Second, this is the core of the paper. Mixing the 2,003,387,582 claims of the four types (4,295,055,777,490 points, 42.95 trillion yen at 10 yen per point) and ranking them by points, the top 1% holds at least 0.4068 of all points, and the top 0.0168 reaches half. The Gini coefficient is at least 0.7322. Every claim in a bracket was set to the bracket mean, so these are lower bounds (Section 4).
Third, ranking the same claims within each type alone, the top 1% holds only inpatient 0.0765, dental 0.0907, pharmacy 0.2330, and outpatient 0.2742 of the points. Inpatient claims are 0.0135 of claims and 0.3871 of points, and 61,498 points per inpatient claim is 41.10 times the outpatient 1,496 points. Of the top 1% of claims when mixed, 0.7992 are inpatient claims (Sections 4 and 5).
Fourth, within types, outpatient is the most concentrated (Gini 0.6153) and dental the least (0.4081), and inpatient (0.4490) is less concentrated than outpatient. Outpatient claims of 20,000 points or more are 0.0081 of claims and hold 0.2537 of points (Sections 5 and 6).
Fifth, by disease chapter, the share of a chapter's outpatient points held by claims of 20,000 points or more is large for blood and immune disorders (0.7141), the genitourinary system (0.7014), and neoplasms (0.5743), and 0.0469 for the respiratory system. Of the outpatient points in claims of 20,000 or more, neoplasms and the genitourinary system together hold 0.5993 (Section 6).
Sixth, what separates them is whether the types are mixed into one ranking or ranked within each type. "Medical costs are concentrated in a small number of claims" holds strongly when the types are mixed, and the claims at the top are then mainly inpatient claims. Concentration exists within types too, strongest for outpatient care.
Scope note: This paper claims no new mathematical theorem and no new law — claim counts and points are in public tables, and this paper only ranked them by points and accumulated them (the Lorenz curve and the Gini coefficient are standard tools). This paper is a structural interpretation of the shape of numbers in public aggregate data; it is not medical advice, not a diagnosis, and not a treatment recommendation. The author is not a physician. Decisions about individual health should be discussed with a physician or a medical institution. This is a preprint that has not been peer reviewed. It does not judge expensive care or drugs, whether medical costs are high or low, or the system. It does not blame patients whose claims carry many points. Counts are claims, not people, and how one person's yearly medical costs are concentrated cannot be told from these tables. Spread within brackets was discarded, so the concentration is a lower bound. Only 7 disease chapters are shown, and the content of treatment by disease is not discussed. Prefectures, insurance schemes, and medical institutions are not compared. About the data: the Survey of Medical Care Benefits (Ministry of Health, Labour and Welfare) was taken from e-Stat and used under the Government of Japan Standard Terms of Use (Version 2.0); the shares and Gini coefficients in this paper were processed from it. What this paper adds: showing how much the concentration of the same claims differs when the types are mixed and when ranked within types, showing that 0.7992 of the top 1% of mixed claims are inpatient claims, checking by merging brackets that bracket-based values are lower bounds, and showing how high-point outpatient claims lean across disease chapters.
1. Notation and question
- Count: the number of claims (medical fee statements). One claim is one person's one month at one medical institution (for pharmacy, one pharmacy), not a count of people.
- Points: 1 point = 10 yen.
- Concentration: rank the point brackets by mean points per claim and read what share of points the top claims hold (the Lorenz curve). Every claim in a bracket is set to the bracket mean, so the values read are lower bounds on the true concentration.
- Mix: put the brackets of inpatient, outpatient, dental, and pharmacy together in one ranking.
Question: How far are medical costs concentrated in a small number of claims? How does the concentration change with what is put into one ranking?
Observation 1.1: M075 looked at national medical expenditure per capita by age. This paper looks at the same medical costs by the size of each claim.
2. Preview and design
Honestly stated: the design was decided after looking at the tables.
| Content | |
|---|---|
| Tables | Survey of Medical Care Benefits FY2023 statistical tables, Table 5 (by point bracket, type of care, and scheme) and Table 6 (by disease classification, type of care, and point bracket, all schemes) |
| Noticed in the preview | Table 5's brackets differ by type (inpatient has 56, from under 500 points to 1,000,000 or more; the others have 55, from under 50 to 100,000 or more). The last bracket is always open at the top, but each bracket's total points are given, so the mean per claim can be computed |
| Comparison | Concentration with the four types mixed and within each type. By disease chapter, the share in the top bracket (outpatient 20,000 points or more, inpatient 80,000 or more) |
3. Data and checks
Calculation 3.1 The 2 retrieved files were fixed by SHA-256, and the following were checked.
- Table 5: for inpatient (56 brackets) and outpatient, dental, and pharmacy (55 brackets each), bracket counts sum to the total count and bracket points to the total points. The first bracket is open at the bottom and the last at the top.
- Table 6: for inpatient and outpatient, every row's brackets sum to its total, and the 20 chapters sum to the total. Table 6's inpatient total (26,631,274 claims) is smaller than Table 5's (27,037,051) — it counts only claims with a disease code.
- Checking the lower bound: merging adjacent brackets in pairs lowers both the Gini coefficient and the top 1% share for all four types (inpatient Gini 0.4490 → 0.4460, outpatient 0.6153 → 0.6143). The finer the brackets, the larger the concentration comes out, so bracket-based values are lower bounds.
4. The core — mixed, the top 1% holds 0.4
Calculation 4.1 The four types (FY2023, all schemes)
| Type | Claims | Share of claims | Share of points | Points per claim |
|---|---|---|---|---|
| Inpatient | 27,037,051 | 0.0135 | 0.3871 | 61,498 |
| Outpatient | 1,028,382,232 | 0.5133 | 0.3583 | 1,496 |
| Dental | 242,705,355 | 0.1211 | 0.0726 | 1,284 |
| Pharmacy | 705,262,944 | 0.3520 | 0.1820 | 1,108 |
| Total | 2,003,387,582 |
Observation 4.2: Total points are 4,295,055,777,490 (42.95 trillion yen at 10 yen per point), and inpatient claims are 0.0135 of claims and 0.3871 of points. The top inpatient bracket (1,000,000 points or more) has 5,526 claims, at 1,698,026 points per claim.
Observation 4.3: Mixing the four types and ranking by points, the top 0.1% holds at least 0.1106 of points, the top 1% 0.4068, and the top 10% 0.6808, and the top 0.0168 reaches half. The Gini coefficient is at least 0.7322.
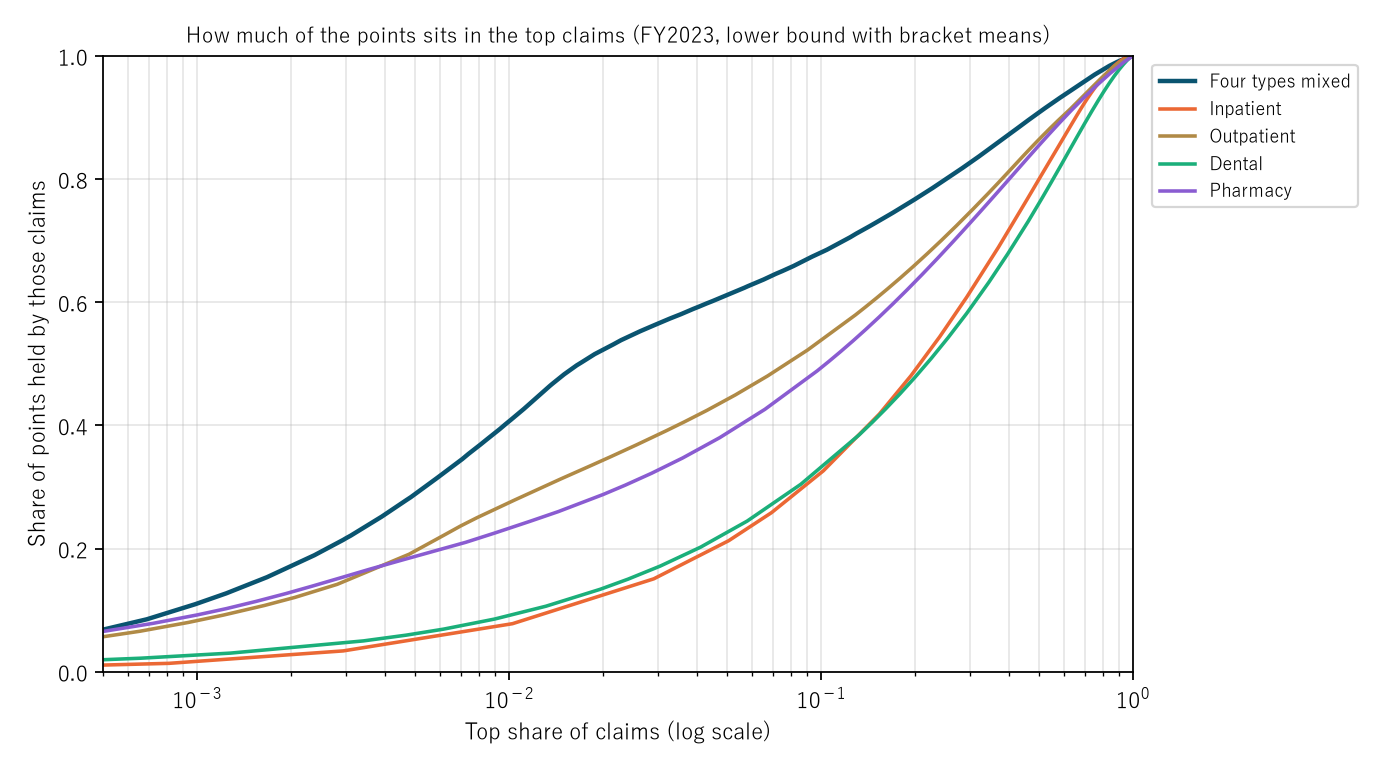
Figure 1: The top share of claims (log scale) and the share of points those claims hold. Navy mixes the four types, orange is inpatient, gold outpatient, green dental, and purple pharmacy. Lower bounds with every claim in a bracket set to the bracket mean.
5. Ranking within each type
Calculation 5.1 Concentration within types (lower bounds with bracket means)
| Ranking | Top 0.1% | Top 1% | Top 10% | Top share holding half | Gini coefficient |
|---|---|---|---|---|---|
| Four types mixed | 0.1106 | 0.4068 | 0.6808 | 0.0168 | 0.7322 |
| Outpatient | 0.0828 | 0.2742 | 0.5366 | 0.0781 | 0.6153 |
| Pharmacy | 0.0922 | 0.2330 | 0.4937 | 0.1036 | 0.5843 |
| Inpatient | 0.0154 | 0.0765 | 0.3229 | 0.2079 | 0.4490 |
| Dental | 0.0265 | 0.0907 | 0.3286 | 0.2179 | 0.4081 |
Observation 5.2: Ranked within each type alone, the top 1% holds less than 0.3 of points in every type. Outpatient is the most concentrated (Gini 0.6153, top 1% 0.2742) and dental the least (0.4081). Inpatient claims are the largest per claim, but concentration within inpatient is smaller than within outpatient (Gini 0.4490, top 1% 0.0765). Half of the points are held by the top 0.2079 for inpatient and the top 0.0781 for outpatient.
Observation 5.3: The mixed top 1% share, 0.4068, is larger than the value within any type. The 61,498 points per inpatient claim are 41.10 times the outpatient value; only 0.0382 of inpatient claims are under 5,000 points, and only 2,426,438 outpatient, dental, and pharmacy claims (0.00123) are 50,000 points or more. The two humps barely overlap, and the top 1% of mixed claims consists of inpatient 0.7992, outpatient 0.1444, pharmacy 0.0545, and dental 0.0019. When one says "medical costs are concentrated in a small number of claims," the claims at the top are mainly inpatient claims.
6. By disease chapter
Calculation 6.1 Outpatient claims of 20,000 points or more by disease chapter (Table 6, claims with a disease code)
| Chapter | Claims | Points per claim | Share of claims at 20,000+ | Share of points at 20,000+ | Share of all outpatient 20,000+ points |
|---|---|---|---|---|---|
| III Blood, immune | 4,124,554 | 5,065 | 0.0231 | 0.7141 | 0.0396 |
| XIV Genitourinary | 40,612,068 | 3,783 | 0.0704 | 0.7014 | 0.2859 |
| II Neoplasms | 38,614,148 | 5,328 | 0.0507 | 0.5743 | 0.3134 |
| IX Circulatory | 176,361,508 | 1,244 | 0.0031 | 0.1022 | 0.0594 |
| XIII Musculoskeletal | 97,291,797 | 1,301 | 0.0026 | 0.0762 | 0.0256 |
| XIX Injury, poisoning | 29,388,260 | 1,418 | 0.0018 | 0.0484 | 0.0054 |
| X Respiratory | 132,592,295 | 992 | 0.0011 | 0.0469 | 0.0164 |
Observation 6.2: Outpatient claims of 20,000 points or more are 0.0081 of claims and hold 0.2537 of points overall. By chapter, the share is large for blood and immune disorders (0.7141), the genitourinary system (0.7014), and neoplasms (0.5743), and smallest among the 7 chapters for the respiratory system (0.0469). It first failed because I wrote that the genitourinary system was the largest — blood and immune disorders' 0.7141 is larger than 0.7014.
Observation 6.3: Of the outpatient points in claims of 20,000 or more, neoplasms (0.3134) and the genitourinary system (0.2859) together hold 0.5993. For inpatient care, claims of 80,000 points or more are 0.2393 of claims and hold 0.5414 of points overall, and among the 7 chapters points per claim are largest for the circulatory system (82,864), then musculoskeletal (75,797) and neoplasms (75,375).
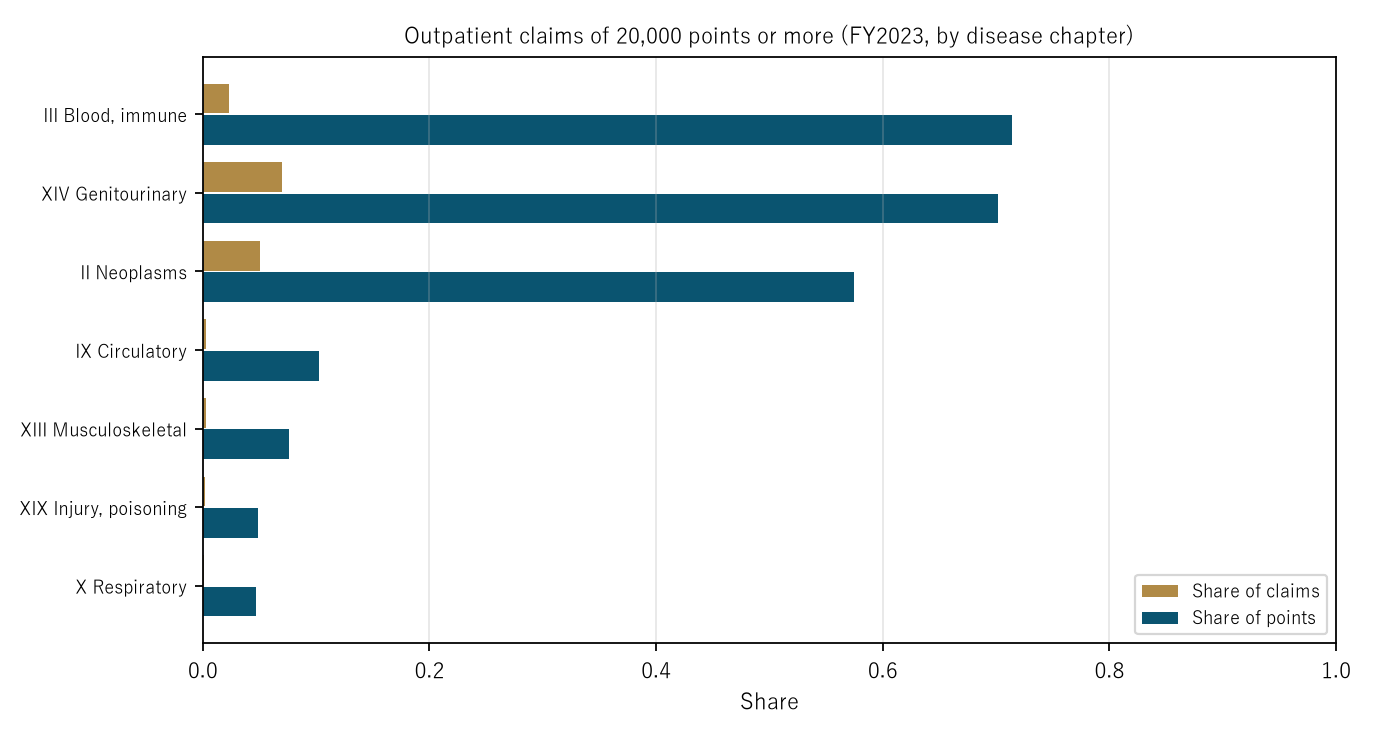
Figure 2: For each outpatient disease chapter, the share of claims (gold) and the share of points (navy) held by claims of 20,000 points or more.
7. Limitations
- Counts are claims, not people. How one person's yearly medical costs are concentrated differs from how monthly, per-institution claims are concentrated, and cannot be told from these tables.
- Every claim in a bracket was set to the bracket mean, so the concentration is a lower bound. Spread within the top bracket (1,000,000 points or more for inpatient, 100,000 or more for the others) is also discarded.
- Table 6 covers only claims with a disease code and is smaller than Table 5's total. Disease chapters follow the main diagnosis on the claim, and only 7 chapters are shown.
- The paper does not judge expensive care or drugs, whether medical costs are high or low, or the system. Prefectures, insurance schemes, and medical institutions are not compared. It is not an outlook for any one person.
Conclusion
Mixing the 2,003,387,582 claims of FY2023 and ranking them by points, the top 1% held at least 0.4068 of all points and the top 0.0168 reached half. Yet ranked within inpatient, outpatient, dental, and pharmacy alone, the top 1% held only 0.0765–0.2742. Inpatient claims were 0.0135 of claims and 0.3871 of points, and outpatient claims of 20,000 points or more were 0.0081 of claims and 0.2537 of points.
One thing separates them — whether the types are mixed into one ranking or ranked within each type.
When you hear "medical costs are concentrated in a small number of claims," check together what was put into one ranking (inpatient and outpatient mixed, or within a type) and whether the count is of claims or of people.
Data and reproduction
| Data | Survey of Medical Care Benefits FY2023 report, statistical tables, Table 5 and Table 6 (Ministry of Health, Labour and Welfare, e-Stat) (retrieved 26 September 2026) |
| Terms of use | e-Stat follows the Government of Japan Standard Terms of Use (Version 2.0). The shares and Gini coefficients in this paper were processed from it and are not numbers produced by the government |
| Coverage | Japan, FY2023, all schemes |
| Verification | 検算/M076.py (--zu also draws the figures). Every number in the text is taken from 検算/M076_output.txt |
| Raw data | data/ holds the retrieved files and SOURCES.md (URLs, retrieval date, SHA-256, terms of use, definitions and how the calculations were set up) |
| Figures | 図/M076_zu1, 図/M076_zu2 (png, svg, English versions) |
References
- Ministry of Health, Labour and Welfare. Survey of Medical Care Benefits FY2023 report, statistical tables, Table 5 and Table 6 (in Japanese). e-Stat (accessed 26 September 2026). https://www.e-stat.go.jp/
- Yamagishi, Y. (2026). Per-Capita National Medical Expenditure Doubles Every 16.52 Years at Ages 40–84, More Than Twice as Long as Death Rates (Men 6.99, Women 7.60 Years) — From FY2000 to FY2023 the Total Rose 1.596-Fold, the Age Composition Alone Would Have Raised It 1.337-Fold, and Per-Capita Growth Was 1.738-Fold at Ages 0–14 Against 1.051-Fold at 70–74 [M075]. Zenodo. https://doi.org/10.5281/zenodo.22978553
Reference
Yamagishi, Y. (2026). Mixing the 2,003,387,582 Claims of FY2023, the Top 1% by Points Holds at Least 0.4068 of All Points, but Ranked Within Inpatient, Outpatient, Dental, and Pharmacy Alone the Top 1% Holds Only 0.0765–0.2742 [M076]. Zenodo.
DOI: 10.5281/zenodo.22978659
YOI: https://www.yamagishiyuuki.com/yoi/M076
ORCID: 0009-0006-8587-3450
PDF (English) · PDF (Japanese) · Date proof of the English PDF (OpenTimestamps .ots) · SHA256SUMS
The record page for this paper (in Japanese, with the PDFs in each language and the date proof): YOI M076. This paper is a preprint and has not been peer reviewed.