Abstract
Using the Ministry of Health, Labour and Welfare's Trends in Dispensing Costs (electronically processed claims), FY2023 edition, this paper split the oral drug cost per prescription into three factors — the number of drug types per prescription, days per drug type, and cost per drug type per day — and looked at their movement over FY2012–FY2023 and their differences across drug classes. No new mathematical theorem and no new law are claimed.
First, the tables are consistent. The product of the three factors matches the cost per prescription in all 12 fiscal years and all 36 drug-class rows (relative difference under 1e-9), and dispensing cost per prescription equals the sum of technical fees, drug costs, and specified insured medical materials (Section 3).
Second, this is the core of the paper. From FY2012 to FY2023, oral drug cost per prescription hardly moved, from 5,180 to 5,334 yen (1.030-fold), but the number of drug types moved 0.962-fold, days per drug type went from 21.10 to 26.99 days (1.279-fold), and cost per drug type per day went from 84.81 to 70.95 yen (0.837-fold). In logarithms, +0.0292 = −0.0387 + 0.2464 − 0.1785: the rise in days is offset by the fall in cost per day (Section 4).
Third, days per drug type rose every year from FY2012 to FY2020, most of all from FY2019 to FY2020, from 25.00 to 28.19 days (1.1274-fold), and then shrank every year to FY2023. Cost per prescription was highest in FY2015, at 6,068 yen (Section 4).
Fourth, by drug class, cost per drug type per day in FY2023 spans 118.3-fold, from 2,271.69 yen for antineoplastics to 19.20 yen for respiratory drugs. From FY2012 to FY2023 it rose for antineoplastics (1.805-fold), hormones (1.500-fold), other metabolic drugs, and blood and body fluid drugs, and fell for allergy drugs (0.394-fold), cardiovascular drugs (0.448-fold), respiratory drugs, and digestive drugs (Section 5).
Fifth, of the 9,343 yen dispensing cost per prescription in FY2023, drug costs are 6,785 yen (0.726), and injectables within them went from 219 yen in FY2012 to 631 yen (2.881-fold). By age, the lowest, 0–4, is 3,470 yen, against 10,964 yen (3.160-fold) for the highest, 80–84 (Section 6).
Sixth, what separates them is quantity (types and days) versus unit price (cost per type per day). Even when "the drug cost of one prescription" hardly moves, days per prescription have lengthened and the price of one day's supply has fallen inside it. The movement of unit price goes in opposite directions across drug classes.
Scope note: This paper claims no new mathematical theorem and no new law — the three factors and the cost per prescription are in public tables, and their product is an identity that follows from the table definitions. This paper only lines them up by year and by drug class. This paper is a structural interpretation of the shape of numbers in public aggregate data; it is not medical advice, not a diagnosis, and not a treatment recommendation. The author is not a physician. Decisions about individual health should be discussed with a physician or a medical institution. This is a preprint that has not been peer reviewed. It does not judge whether drug prices are high or low, good or bad, nor drug efficacy or safety, nor prescribing, nor the drug pricing and fee systems. No product or manufacturer names are used; the unit of aggregation is the drug class. Why days lengthened or why cost per day fell (price revisions, generic drugs, changes in which drugs are used) cannot be separated with these tables. Drug classes related to infections and mental health are not shown. Prefectures and pharmacies are not compared. About the data: Trends in Dispensing Costs (Ministry of Health, Labour and Welfare) was taken from the Ministry's website and used under the Public Data License (Version 1.0); the ratios and shares in this paper were processed from it. What this paper adds: showing through a sum of logarithms that the three factors moved strongly in opposite directions over the 11 years in which the cost per prescription hardly moved, showing that the rise in days turned back in FY2020, and showing that the movement of cost per type per day goes in opposite directions across drug classes.
1. Notation and question
- Cost per prescription: oral drug cost per prescription (yen).
- Number of types: number of drug types per prescription. Drugs with the same dosage form, drug class, and generic name count as one type.
- Days: days per drug type (days).
- Cost per type per day: cost per drug type per day (yen). Also called "unit price" below.
- Identity: cost per prescription = number of types × days × cost per type per day (it follows from the table definitions).
Question: When the drug cost of one prescription does not move, are the three factors inside it also still? Does the unit price move in the same direction for different kinds of drugs?
Observation 1.1: M075 measured the years it takes per-capita pharmacy dispensing expenditure to double with age. M076 looked at how dispensing claims are concentrated within type. This paper splits the drug cost of one prescription into three factors.
2. Preview and design
Honestly stated: the design was decided after looking at the tables.
| Content | |
|---|---|
| Tables | Trends in Dispensing Costs (electronically processed claims), FY2023 edition (Excel on the Ministry's website): Tables 2-2, 3, 5, 6-2, 7, 8, 9 |
| Noticed in the preview | Table 5 gives the three factors for FY2012–FY2023, and Tables 6-2 to 9 give the same three by drug class. In Table 3, the 5 age groups of 80 and over have numbers only from FY2014 |
| Comparison | The FY2012→FY2023 ratios of the three factors and their sum of logarithms, the three factors and the unit price ratio for 8 drug classes in FY2023, and the drug costs within dispensing costs and their age shape |
3. Data and checks
Calculation 3.1 The 3 retrieved files were fixed by SHA-256, and the following were checked.
- Table 5: number of types × days × cost per type per day = cost per prescription holds in all 12 fiscal years with relative difference under 1e-9.
- Tables 6-2, 7, 8, 9: the drug-class rows agree across the same 36 rows, and for every class and year the product of the three factors matches the cost per prescription. There are 15 major classes.
- Table 2-2: technical fees + drug costs + specified insured medical materials = dispensing cost, and drug costs = oral + as-needed and other + injectables + external (12 fiscal years, under 1 yen). Table 2-2's oral drugs and Table 5's cost per prescription are counted slightly differently, with a difference of at most 13.4 yen.
- Table 3: total and 21 age groups. I first read each row's numbers packed to the left, and in the rows for 80 and over, which have numbers only from FY2014, took the year-on-year ratios for amounts (noticed when 100+ came out negative). I reread by the column positions of the headings.
4. The core — three factors multiplied
Calculation 4.1 Oral drug cost per prescription and its three factors
| Fiscal year | Per prescription (yen) | Number of types | Days | Cost per type per day (yen) |
|---|---|---|---|---|
| 2012 | 5,180 | 2.895 | 21.10 | 84.81 |
| 2015 | 6,068 | 2.860 | 22.76 | 93.21 |
| 2019 | 5,478 | 2.788 | 25.00 | 78.59 |
| 2020 | 5,886 | 2.760 | 28.19 | 75.65 |
| 2023 | 5,334 | 2.785 | 26.99 | 70.95 |
| Ratio (2023 ÷ 2012) | 1.030 | 0.962 | 1.279 | 0.837 |
Observation 4.2: From FY2012 to FY2023, cost per prescription hardly moved at 1.030-fold, but days rose 1.279-fold, cost per type per day fell to 0.837-fold, and the number of types moved 0.962-fold. In differences of logarithms, per prescription +0.0292 = types −0.0387 + days +0.2464 + cost per type per day −0.1785. The +0.2464 of days and the −0.1785 of unit price are both far larger than the +0.0292 per prescription and offset each other.
Observation 4.3: Days rose every year from FY2012 to FY2020, most of all from FY2019 to FY2020 (25.00 → 28.19 days, 1.1274-fold), and shrank every year from FY2020 to FY2023. In the same year, cost per prescription went from 5,478 to 5,886 yen (1.0745-fold). Cost per prescription was highest in FY2015 (6,068 yen) and lowest in FY2012 (5,180 yen).
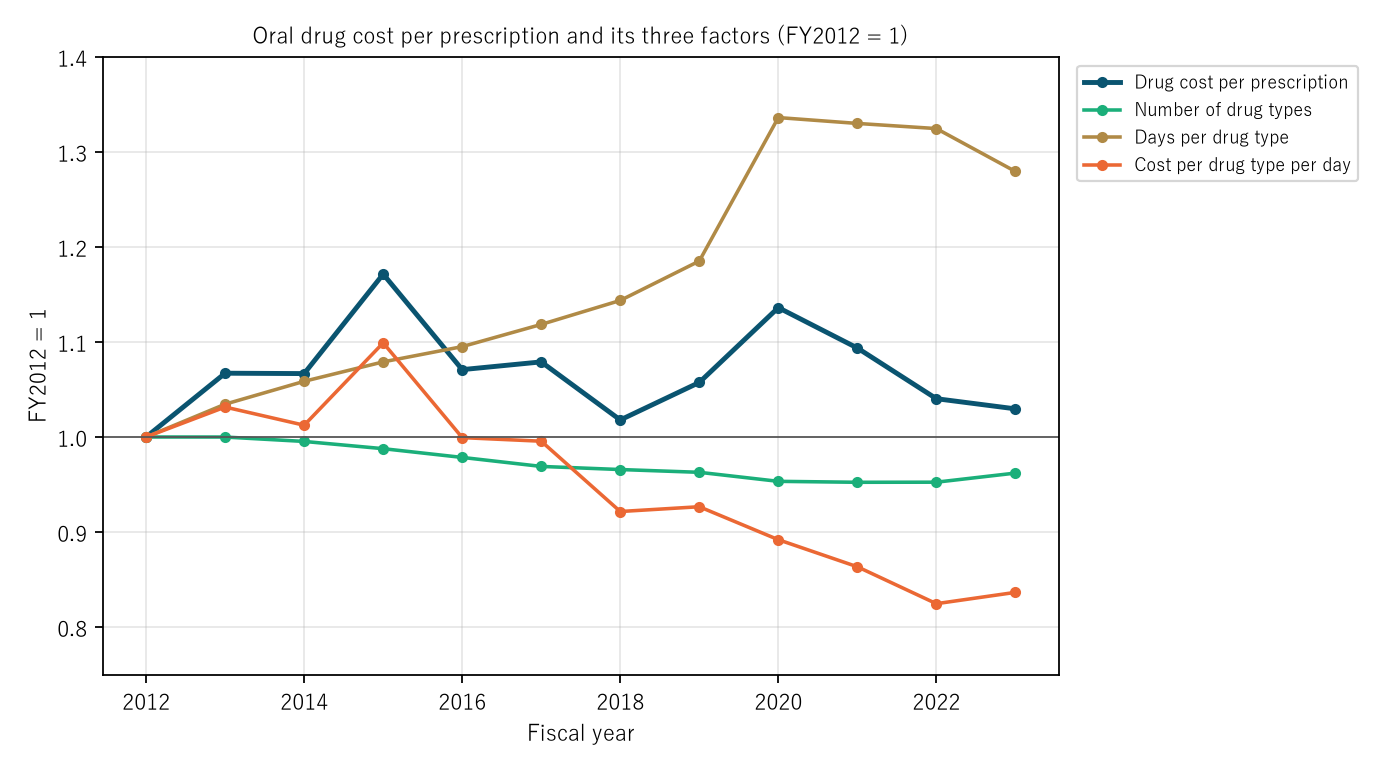
Figure 1: Ratios with FY2012 = 1. Navy is the cost per prescription, green the number of types, gold days per type, and orange cost per type per day.
5. Splitting by drug class
Calculation 5.1 The three factors in FY2023 (oral drugs, 8 drug classes)
| Drug class | Per prescription (yen) | Number of types | Days | Cost per type per day (yen) | Unit price ratio | Days ratio |
|---|---|---|---|---|---|---|
| Other metabolic | 988.4 | 0.2352 | 33.55 | 125.25 | 1.072 | 1.354 |
| Cardiovascular | 769.1 | 0.6209 | 36.22 | 34.20 | 0.448 | 1.231 |
| Antineoplastic | 694.6 | 0.0072 | 42.46 | 2,271.69 | 1.805 | 1.132 |
| Digestive | 444.9 | 0.4153 | 26.93 | 39.77 | 0.844 | 1.278 |
| Blood and body fluid | 397.3 | 0.1434 | 27.06 | 102.39 | 1.060 | 1.047 |
| Allergy | 213.7 | 0.2143 | 22.47 | 44.39 | 0.394 | 1.484 |
| Hormones | 136.9 | 0.0575 | 32.99 | 72.08 | 1.500 | 1.347 |
| Respiratory | 42.5 | 0.2398 | 9.24 | 19.20 | 0.639 | 1.155 |
Ratios are FY2023 ÷ FY2012.
Observation 5.2: Cost per type per day spans 118.3-fold, from 2,271.69 yen for antineoplastics to 19.20 yen for respiratory drugs, and antineoplastics are 66.4 times cardiovascular drugs. Cardiovascular drugs have the most types (0.6209), and their 769.1 yen per prescription builds up from types and days (36.22 days). Antineoplastics reach 694.6 yen with only 0.0072 types, from 42.46 days and the unit price.
Observation 5.3: From FY2012 to FY2023, cost per type per day rose for 4 classes — antineoplastics (1.805-fold), hormones (1.500-fold), other metabolic drugs (1.072-fold), and blood and body fluid drugs (1.060-fold) — and fell for 4 — allergy drugs (0.394-fold), cardiovascular drugs (0.448-fold), respiratory drugs (0.639-fold), and digestive drugs (0.844-fold). Days rose in all 8 classes (1.047–1.484-fold). Cost per prescription became 2.633-fold for antineoplastics and 0.557-fold for cardiovascular drugs.
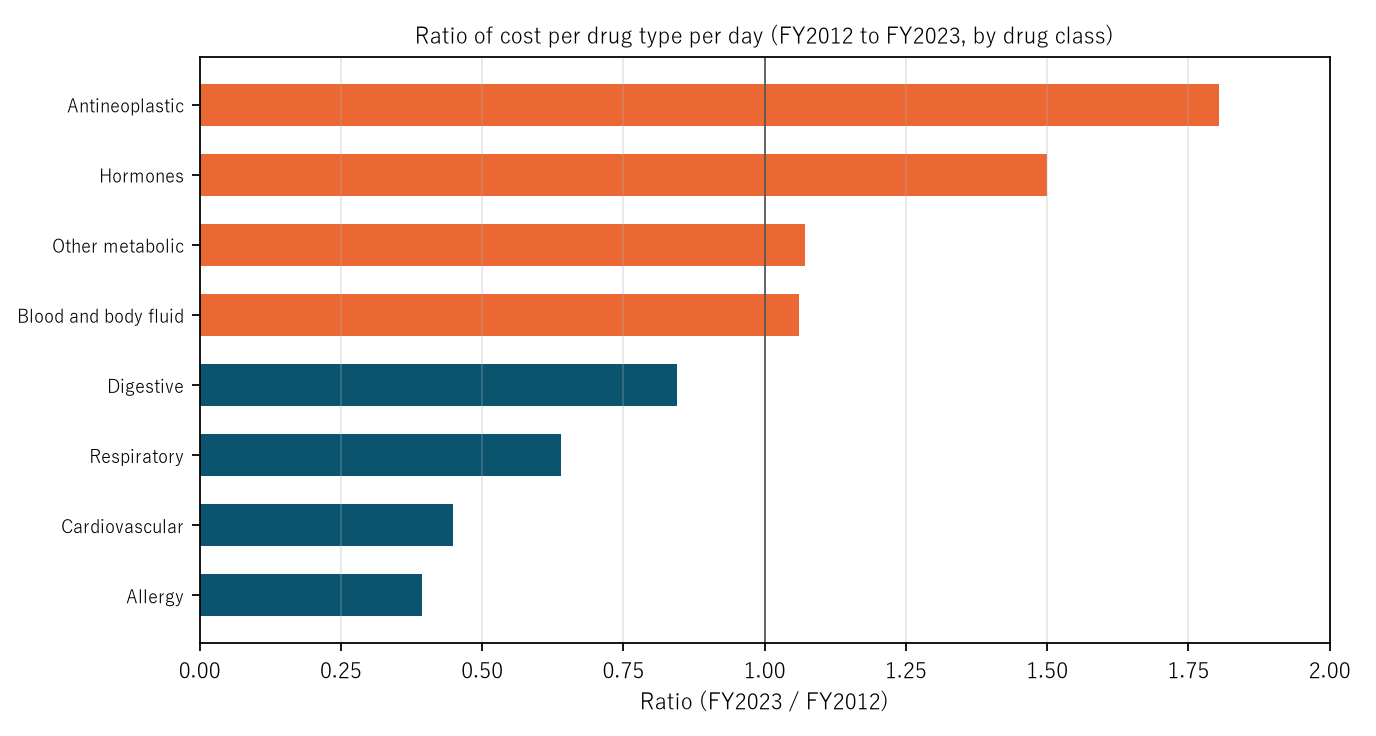
Figure 2: The FY2012→FY2023 ratio of cost per drug type per day (8 drug classes). Orange classes rose, navy classes fell.
6. Drug costs within dispensing costs, and age
Observation 6.1: The 9,343 yen dispensing cost per prescription in FY2023 is the sum of technical fees 2,540 yen, drug costs 6,785 yen, and specified insured medical materials 18 yen; the share of drug costs is 0.726 (0.740 in FY2012). Drug costs break down into oral 5,339, external 777, injectables 631, and as-needed and other 38 yen.
Observation 6.2: Injectables (per prescription) were larger than the year before in every one of the 12 fiscal years, rising from 219 to 631 yen (2.881-fold), and their share of drug costs went from 0.035 to 0.093. Oral drugs went from 5,192 to 5,339 yen (1.028-fold).
Observation 6.3: Dispensing cost per prescription in FY2023 is lowest at 0–4, 3,470 yen, and highest at 80–84, 10,964 yen (3.160 times 0–4). It does not rise steadily: 20–24, at 7,372 yen, is lower than 15–19, at 7,594 yen. Ages 60–64 are at 10,301 yen and 100+ at 7,689 yen.
7. Limitations
- Why days lengthened or why cost per type per day fell (price revisions, generic drugs, changes in which drugs are used) cannot be separated with these tables. The movement of cost per type per day contains both price changes of the same drugs and changes in the mix of drugs used.
- The coverage is electronically processed dispensing (prescriptions at insurance pharmacies), and drugs given inside medical institutions are not included. The three factors cover oral drugs only.
- Only 8 drug classes are shown, and classes related to infections and mental health are not shown. As Table 9's note says, some drug classes are not displayed.
- The paper does not judge drug prices or prescribing, efficacy or safety, or the system. Prefectures and pharmacies are not compared. It is not an outlook for any one person.
Conclusion
Oral drug cost per prescription hardly moved from FY2012 to FY2023, from 5,180 to 5,334 yen (1.030-fold). Split into three factors, however, the number of types moved 0.962-fold, days 1.279-fold, and cost per type per day 0.837-fold, and the fall in unit price offset the rise in days. Unit price moved in opposite directions across drug classes, rising 1.805-fold for antineoplastics and falling to 0.448-fold for cardiovascular drugs.
One thing separates them — quantity (types and days) or unit price.
When you hear "drug costs have risen" or "drug costs have not changed," check together whether it is about the number of types in one prescription, the days, or the price of one day's supply.
Data and reproduction
| Data | Trends in Dispensing Costs (electronically processed claims), FY2023 edition (Ministry of Health, Labour and Welfare website) (retrieved 26 September 2026) |
| Terms of use | The Ministry's website follows the Public Data License (Version 1.0). The ratios and shares in this paper were processed from it and are not numbers produced by the government |
| Coverage | Japan, FY2012–FY2023, dispensing at insurance pharmacies (electronically processed) |
| Verification | 検算/M077.py (--zu also draws the figures). Every number in the text is taken from 検算/M077_output.txt |
| Raw data | data/ holds the retrieved files and SOURCES.md (URLs, retrieval date, SHA-256, terms of use, definitions and how the calculations were set up) |
| Figures | 図/M077_zu1, 図/M077_zu2 (png, svg, English versions) |
References
- Ministry of Health, Labour and Welfare. Trends in Dispensing Costs (electronically processed claims), FY2023 edition, Tables 2-2, 3, 5, 6-2, 7, 8, 9 (in Japanese; accessed 26 September 2026). https://www.mhlw.go.jp/topics/medias/year/23/gaiyou.html
- Yamagishi, Y. (2026). Per-Capita National Medical Expenditure Doubles Every 16.52 Years at Ages 40–84, More Than Twice as Long as Death Rates (Men 6.99, Women 7.60 Years) — From FY2000 to FY2023 the Total Rose 1.596-Fold, the Age Composition Alone Would Have Raised It 1.337-Fold, and Per-Capita Growth Was 1.738-Fold at Ages 0–14 Against 1.051-Fold at 70–74 [M075]. Zenodo. https://doi.org/10.5281/zenodo.22978553
- Yamagishi, Y. (2026). Mixing the 2,003,387,582 Claims of FY2023, the Top 1% by Points Holds at Least 0.4068 of All Points, but Ranked Within Inpatient, Outpatient, Dental, and Pharmacy Alone the Top 1% Holds Only 0.0765–0.2742 — Inpatient Claims Are 0.0135 of Claims and 0.3871 of Points, and Outpatient Claims of 20,000 Points or More Are 0.0081 of Claims and 0.2537 of Points [M076]. Zenodo. https://doi.org/10.5281/zenodo.22978659
Reference
Yamagishi, Y. (2026). Oral Drug Cost per Prescription Hardly Moved from FY2012 to FY2023, from 5,180 to 5,334 Yen (1.030-Fold), but Split into Number of Drug Types, Days per Type, and Cost per Type per Day It Moved 0.962-, 1.279-, and 0.837-Fold [M077]. Zenodo.
DOI: 10.5281/zenodo.22978716
YOI: https://www.yamagishiyuuki.com/yoi/M077
ORCID: 0009-0006-8587-3450
PDF (English) · PDF (Japanese) · Date proof of the English PDF (OpenTimestamps .ots) · SHA256SUMS
The record page for this paper (in Japanese, with the PDFs in each language and the date proof): YOI M077. This paper is a preprint and has not been peer reviewed.