Abstract
Using the Ministry of Health, Labour and Welfare's Statistics of Medical Care Activities in Public Health Insurance (claims reviewed in August 2025), Pharmacy Table 6 and Medical Care Table 17, this paper looked at how the number of drug types on one statement spreads with age. No new mathematical theorem and no new law are claimed.
First, the tables are consistent. In every row, the counts for 1–9 types and 10 or more sum to the total; the 19 age groups sum to the total; general and late-elderly care sum to the total; and the table's types per statement is not smaller than the lower-bound mean that sets 10 or more to 10 (Section 3).
Second, this is the core of the paper. For pharmacy oral drugs (dispensing outside the clinic), drug types per statement are fewest at 20–24, 2.66, and 5.49 at 90+ (2.064-fold). Yet the share with 10 or more types goes from 0.0064 to 0.1339 (20.97-fold), and the share with 5 or more rises 3.912-fold. While the mean roughly doubles, the tail of the distribution widens more than 20-fold (Section 4).
Third, the share with 10 or more types rises in every five-year group from 20–24 to 90+, and the share with just 1 type is largest at 20–24, 0.3322, and falls in every five-year group from there (0.1214 at 90+). The median goes from 2 types to 5. Of the statements with 10 or more types, 0.628 are at 75+, while 75+ is 0.312 of all statements (Section 4).
Fourth, ages 0–4 (3.19) have more per statement than 5–9 (2.84), and the age shape is close to a U with its bottom in the twenties (Section 4).
Fifth, for in-clinic dispensing (medical care, outpatient, medication), 90+ ÷ 20–24 is 1.869-fold in the mean and 15.12-fold in the share with 10 or more — the same shape. The fewest are at 25–29 (2.38), one group off from the pharmacy's 20–24 (Section 5).
Sixth, what separates them is whether one looks at the mean or at the tail of the distribution. "People take more kinds of drugs as they age" is about 2-fold if said of the mean, and more than 20-fold if said of the tail at 10 or more types.
Scope note: This paper claims no new mathematical theorem and no new law — counts and types per statement are in public tables, and this paper only lines them up by age as shares and ratios. This paper is a structural interpretation of the shape of numbers in public aggregate data; it is not medical advice, not a diagnosis, and not a treatment recommendation. The author is not a physician. Decisions about individual health should be discussed with a physician or a medical institution. This is a preprint that has not been peer reviewed. It does not judge whether many or few drugs are good or bad, whether prescribing is good or bad, or whether drugs should be reduced — "5 or more" and "10 or more" are used only as the brackets of the tables. It does not blame people who take drugs, nor the physicians or pharmacies who provide them. Counts are statements (one month, one pharmacy or institution), not people, and the total drugs one person receives from several pharmacies or institutions cannot be told from these tables. It is a cross-section of one month (claims reviewed in August 2025), and movement over years is not examined. Prefectures, pharmacies, and institutions are not compared. About the data: the Statistics of Medical Care Activities in Public Health Insurance (Ministry of Health, Labour and Welfare) was taken from e-Stat and used under the Government of Japan Standard Terms of Use (Version 2.0); the shares and ratios in this paper were processed from it. What this paper adds: measuring the same spread with age with three yardsticks — the mean, 5 or more, and 10 or more — and showing that the ratio grows toward the tail, showing that most statements with 10 or more types are at 75+, and showing the same shape for dispensing outside and inside the clinic.
1. Notation and question
- Count: the number of statements (claims). One statement is one person's one month at one pharmacy (or institution), not a count of people.
- Types per statement: the table's "number of drug types per statement."
- Share with 5 or more, 10 or more: the bracket's count ÷ total. Median: the number of types at which the brackets, accumulated from the bottom, reach half.
- Outside the clinic: the dosage form "oral drugs" in Pharmacy Table 6. Inside the clinic: "outpatient" in Medical Care Table 17 (the medication category).
Question: Is "people take more kinds of drugs as they age" a rise in the mean, or a rise in statements carrying many types? Do the two move at the same speed?
Observation 1.1: M077 looked at the number of oral drug types per prescription by fiscal year. This paper's number of types is per statement (one month, one pharmacy) and is counted differently. This paper looks at the shape of its distribution by age.
2. Preview and design
Honestly stated: the design was decided after looking at the tables.
| Content | |
|---|---|
| Tables | Statistics of Medical Care Activities in Public Health Insurance, 2025, drug use: Pharmacy Table 6 and Medical Care Table 17 (claims reviewed in August 2025) |
| Noticed in the preview | Both give, by age group, counts in brackets of 1–9 types and 10 or more, and types per statement. The pharmacy CSV was UTF-8 and the medical care CSV Shift_JIS |
| Comparison | Mean, median, and shares with 1, 5 or more, and 10 or more types by age, and the ratio to 20–24. The shape is compared between outside and inside the clinic (the drug coverage differs, so levels are not compared) |
3. Data and checks
Calculation 3.1 The 2 retrieved files were fixed by SHA-256, and the following were checked.
- In both tables, in every row, counts for 1–9 types and 10 or more sum to the total, the 19 age groups sum to the total, and general + late-elderly care = total.
- The table's types per statement is not smaller than the lower-bound mean that sets 10 or more to 10 (within two-decimal rounding). The mean within 10 or more back-calculated from it is 10.3–12.5 types for pharmacy oral drugs.
- Totals: pharmacy oral drugs have 51,260,322 statements (3.51 per statement, median 3 types, 10 or more 0.0373); in-clinic outpatient has 11,389,697 (3.19 per statement, median 2 types, 10 or more 0.0291).
4. The core — the mean doubles, the tail grows 20-fold
Calculation 4.1 Pharmacy oral drugs (outside the clinic): drug types by age
| Age | Statements | Per statement | Median | 1 type | 5 or more | 10 or more |
|---|---|---|---|---|---|---|
| 0–4 | 1,935,933 | 3.19 | 3 | 0.2102 | 0.2150 | 0.0043 |
| 5–9 | 1,691,115 | 2.84 | 3 | 0.2851 | 0.1677 | 0.0035 |
| 20–24 | 1,109,768 | 2.66 | 2 | 0.3322 | 0.1415 | 0.0064 |
| 40–44 | 1,979,422 | 2.94 | 2 | 0.2926 | 0.1808 | 0.0158 |
| 60–64 | 3,568,478 | 3.31 | 3 | 0.2429 | 0.2336 | 0.0282 |
| 75–79 | 5,864,784 | 3.81 | 3 | 0.2047 | 0.3130 | 0.0464 |
| 85–89 | 3,202,446 | 4.81 | 4 | 0.1558 | 0.4570 | 0.0988 |
| 90+ | 2,166,243 | 5.49 | 5 | 0.1214 | 0.5537 | 0.1339 |
Observation 4.2: Types per statement are fewest at 20–24 (2.66) and 5.49 at 90+. 90+ ÷ 20–24 is 2.064-fold in the mean, 3.912-fold in the share with 5 or more, and 20.97-fold in the share with 10 or more. For the same spread with age, the further toward the tail one looks, the larger the ratio. The share with 1 type becomes 0.365-fold.
Observation 4.3: The share with 10 or more rises in every five-year group from 20–24 to 90+, and the share with just 1 type is largest at 20–24 (0.3322) and falls in every five-year group from there. The median goes from 2 types at 20–24 to 5 at 90+. Of statements with 10 or more types, 0.628 are at 75+, while 75+ is 0.312 of all statements.
Observation 4.4: Ages 0–4 have 3.19 per statement, more than 5–9 (2.84). Ages 0–4 have a small share with 1 type (0.2102) and a large share with 5 or more (0.2150), but only 0.0043 with 10 or more. The age shape is close to a U with its bottom in the twenties, but the height at 0–4 does not show in the tail at 10 or more.
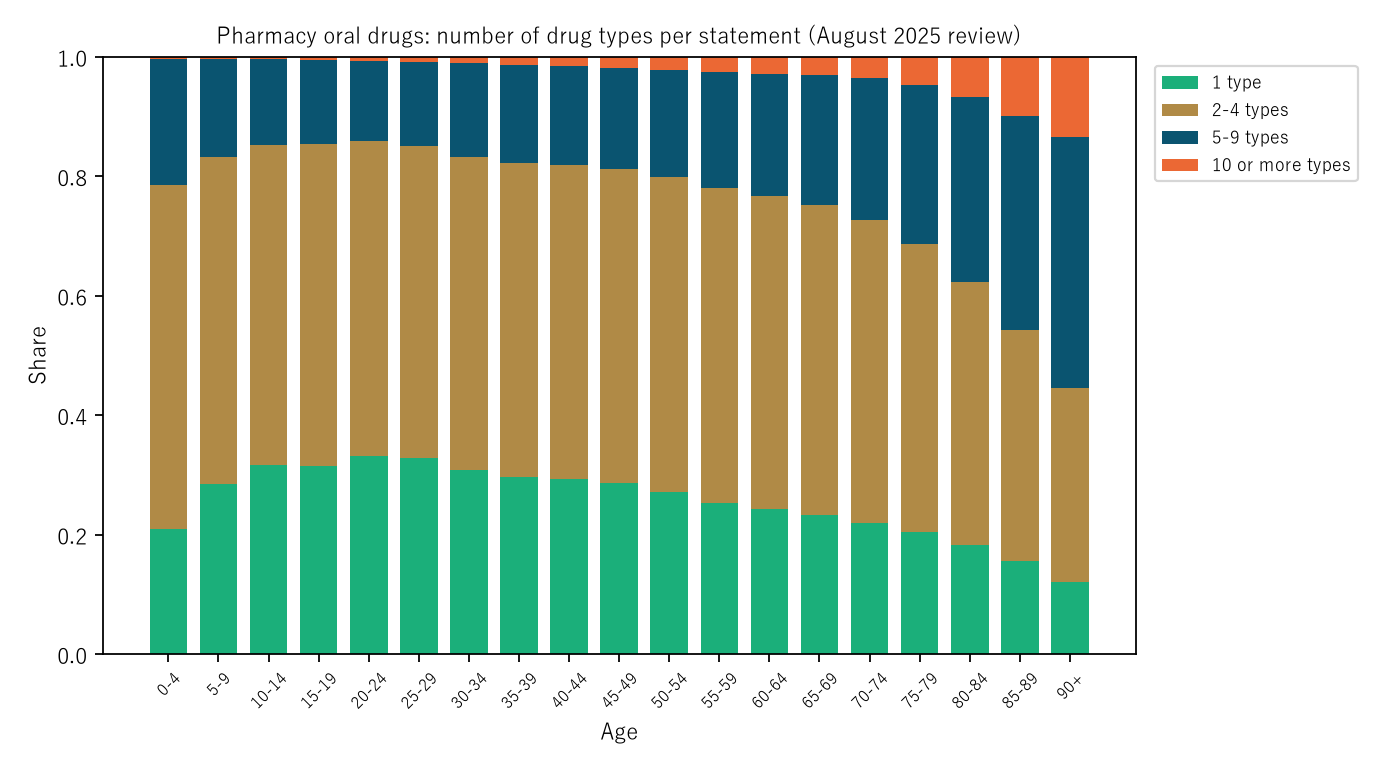
Figure 1: How pharmacy oral-drug statements split by number of drug types (by age). Green is 1 type, gold 2–4, navy 5–9, and orange 10 or more.
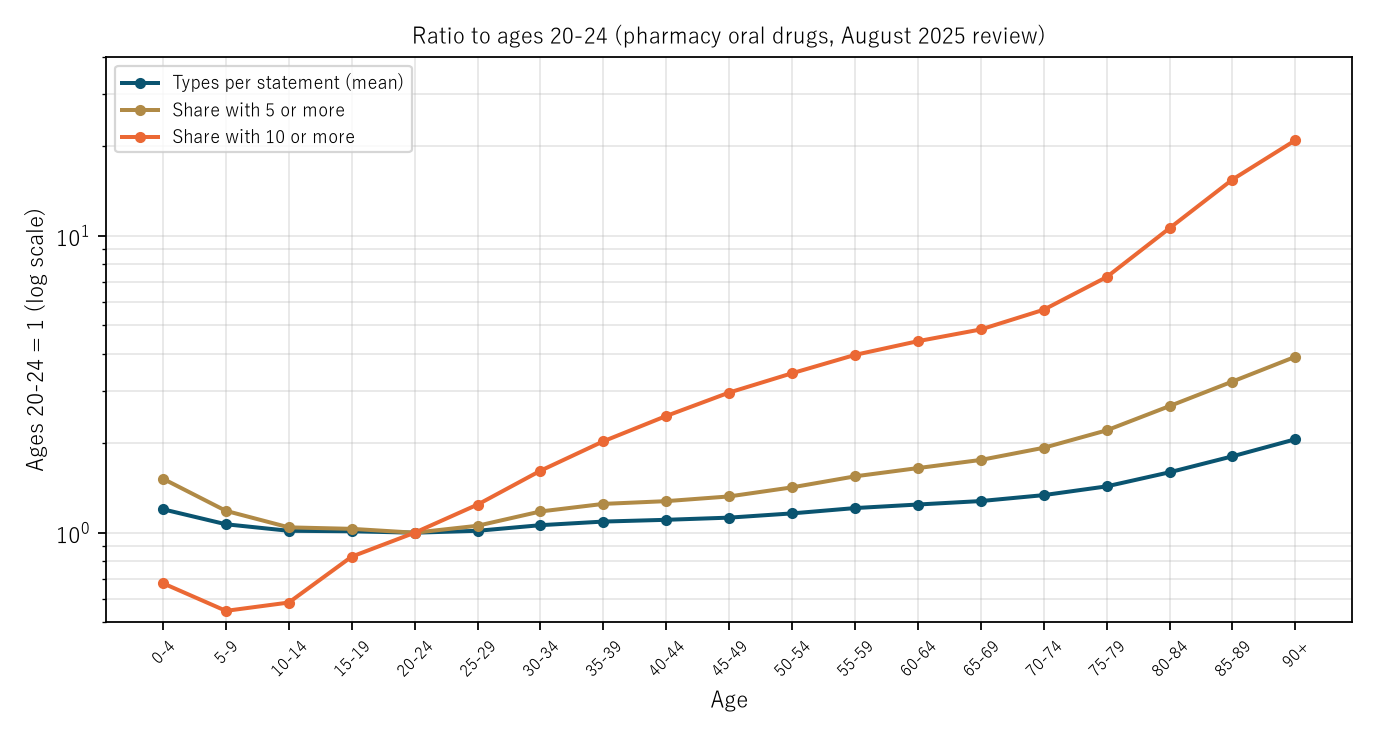
Figure 2: Ratios with ages 20–24 = 1 (log scale). Navy is types per statement (mean), gold the share with 5 or more, and orange the share with 10 or more.
5. Does in-clinic dispensing show the same shape?
Calculation 5.1 Medical care, outpatient, medication (inside the clinic)
| Age | Statements | Per statement | Median | 1 type | 5 or more | 10 or more |
|---|---|---|---|---|---|---|
| 0–4 | 162,751 | 2.64 | 2 | 0.3576 | 0.1513 | 0.0090 |
| 20–24 | 288,993 | 2.45 | 2 | 0.4052 | 0.1205 | 0.0063 |
| 25–29 | 355,215 | 2.38 | 2 | 0.4252 | 0.1121 | 0.0063 |
| 60–64 | 822,335 | 3.12 | 2 | 0.2734 | 0.2024 | 0.0245 |
| 85–89 | 672,742 | 4.15 | 3 | 0.2000 | 0.3548 | 0.0711 |
| 90+ | 360,907 | 4.58 | 4 | 0.1799 | 0.4137 | 0.0955 |
Observation 5.2: Inside the clinic too, 90+ ÷ 20–24 is 1.869-fold in the mean, 3.433-fold in the share with 5 or more, and 15.12-fold in the share with 10 or more; the ratio grows toward the tail. The fewest per statement are at 25–29 (2.38), one group off from the pharmacy's 20–24. Table 17 counts all drugs in medication, while pharmacy oral drugs count only oral drugs, so the drug coverage differs; levels were not compared, only shapes.
6. Limitations
- Counts are statements, not people. Drugs one person receives from several pharmacies or institutions are on separate statements, and their total cannot be told from these tables.
- It is a cross-section of one month (claims reviewed in August 2025); seasonal and yearly movement is not examined.
- Ten or more is an open-ended bracket, and the mean within it was back-calculated from the table's mean (with rounding error).
- The paper does not judge the number of drugs or prescribing. Prefectures, pharmacies, and institutions are not compared. It is not an outlook for any one person.
Conclusion
Drug types per pharmacy oral-drug statement went from 2.66 at 20–24 to 5.49 at 90+, 2.064-fold. Over the same spread with age, the share with 5 or more rose 3.912-fold and the share with 10 or more rose from 0.0064 to 0.1339, 20.97-fold. Of statements with 10 or more types, 0.628 were at 75+, and in-clinic dispensing showed the same shape, 1.869-fold in the mean against 15.12-fold for 10 or more.
One thing separates them — looking at the mean, or at the tail of the distribution.
When you hear "people take more kinds of drugs as they age," check together whether it is about the mean or about the share of statements carrying many types.
Data and reproduction
| Data | Statistics of Medical Care Activities in Public Health Insurance, 2025, drug use: Pharmacy Table 6 and Medical Care Table 17 (Ministry of Health, Labour and Welfare, e-Stat) (retrieved 26 September 2026) |
| Terms of use | e-Stat follows the Government of Japan Standard Terms of Use (Version 2.0). The shares and ratios in this paper were processed from it and are not numbers produced by the government |
| Coverage | Japan, claims reviewed in August 2025 |
| Verification | 検算/M078.py (--zu also draws the figures). Every number in the text is taken from 検算/M078_output.txt |
| Raw data | data/ holds the retrieved files and SOURCES.md (URLs, retrieval date, SHA-256, terms of use, definitions and how the calculations were set up) |
| Figures | 図/M078_zu1, 図/M078_zu2 (png, svg, English versions) |
References
- Ministry of Health, Labour and Welfare. Statistics of Medical Care Activities in Public Health Insurance, 2025, drug use: Pharmacy Table 6 and Medical Care Table 17 (in Japanese). e-Stat (accessed 26 September 2026). https://www.e-stat.go.jp/
- Yamagishi, Y. (2026). Oral Drug Cost per Prescription Hardly Moved from FY2012 to FY2023, from 5,180 to 5,334 Yen (1.030-Fold), but Split into Number of Drug Types, Days per Type, and Cost per Type per Day It Moved 0.962-, 1.279-, and 0.837-Fold — Cost per Type per Day for Antineoplastics, 2,271.69 Yen, Is 118.3 Times That for Respiratory Drugs, and It Rose in 4 of 8 Drug Classes and Fell in 4 [M077]. Zenodo. https://doi.org/10.5281/zenodo.22978716
Reference
Yamagishi, Y. (2026). Drug Types per Pharmacy Oral-Drug Statement Rise from 2.66 at Ages 20–24 to 5.49 at 90+ (2.064-Fold), but the Share with 10 or More Types Rises from 0.0064 to 0.1339 (20.97-Fold) [M078]. Zenodo.
DOI: 10.5281/zenodo.22978769
YOI: https://www.yamagishiyuuki.com/yoi/M078
ORCID: 0009-0006-8587-3450
PDF (English) · PDF (Japanese) · Date proof of the English PDF (OpenTimestamps .ots) · SHA256SUMS
The record page for this paper (in Japanese, with the PDFs in each language and the date proof): YOI M078. This paper is a preprint and has not been peer reviewed.