Abstract
The number of industrial subcategories present in a municipality is almost fully determined by the common logarithm of population (R001; R² = 0.925).
This paper asks whether the residual can be explained by income, land prices or population change.
None of them explains much. Correlations with the residual are r = +0.106 for taxable income per taxpayer (1,721 municipalities), r = +0.064 for commercial land price in logs (1,352), and r = −0.082 for the five-year rate of population change (1,889).
Among the 1,186 municipalities having both income and land price, adding all three to the population-only fit (R² = 0.9101) raises it only to R² = 0.9236.
By contrast, the median residual by prefecture ranges from −23.4 to +15.0 — a spread of 38.4 subcategories, exceeding the residual standard deviation of 25.6.
Highest are Fukui (+15.0), Hiroshima (+14.9) and Yamanashi (+13.5); lowest are Okinawa (−23.4), Fukuoka (−20.7) and Kanagawa (−19.3). Hokkaido is +1.0, ranking 25th of 47 — exactly in the middle.
What population leaves unexplained is accounted for not by how wealthy a municipality is, but by where it is.
1. Introduction
R001 showed that the number of industrial subcategories in a municipality is almost fully determined by log population, and proposed the residual as a quantity specific to the place.
The natural next question follows.
What explains the residual?
The plausible candidates — residents' income, land prices, and population change — are all available per municipality as open data.
2. Data
| Establishments | Statistics Bureau of Japan and METI, 2021 Economic Census for Business Activity (1 June 2021) |
| Population | MIC, Basic Resident Register population, 1 January 2026 (and 1 January 2021) |
| Income | MIC, Survey of Municipal Taxation, FY2025. Taxable income per taxpayer |
| Land price | Land Price Publication 2026 (National Land Numerical Information). Mean commercial land price, yen/m² |
| Matched | Municipalities |
|---|---|
| Population and subcategories available | 1,889 |
| Income available | 1,721 |
| Land price available | 1,352 |
| Both income and land price | 1,186 |
Municipalities without a commercial standard site have no land price. Those missing are concentrated among smaller municipalities; the missingness is not random.
3. Results
3-1 None of them explains much
The population-only fit is subcategories present = 134.93 × log₁₀(population) − 378.69 (R² = 0.925, n = 1,889). Correlations with its residual:
| Variable | Correlation | Municipalities |
|---|---|---|
| Taxable income per taxpayer (thousand yen) | +0.106 | 1,721 |
| Commercial land price (yen/m², log) | +0.064 | 1,352 |
| Five-year rate of population change | −0.082 | 1,889 |
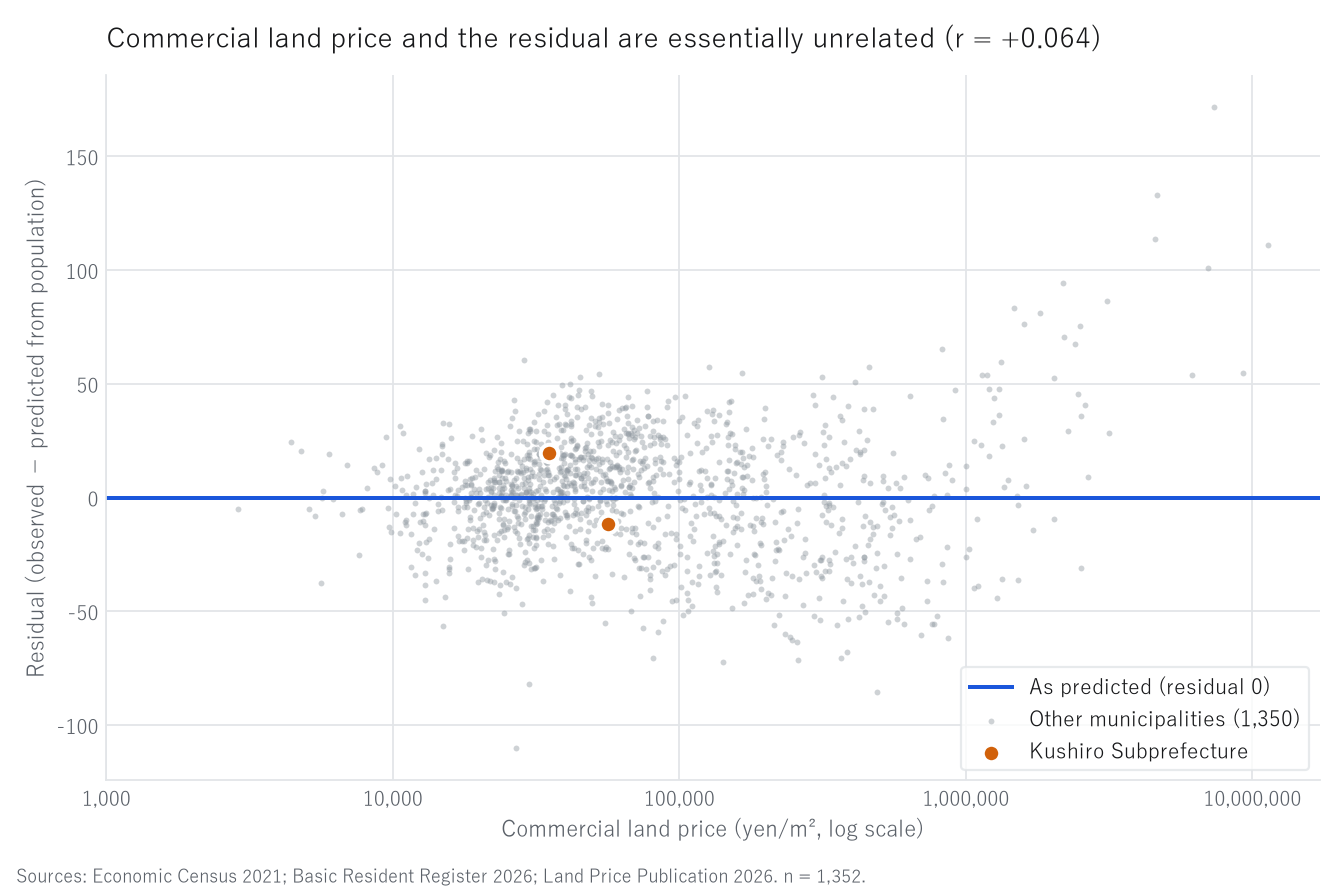
Figure 1. Commercial land price and the residual (1,352 municipalities).
Grey points are the other municipalities, the blue line marks a residual of zero (as predicted from population), and the orange points are the Kushiro Subprefecture. The horizontal axis is on a common-logarithmic scale.
3-2 Adding variables barely raises R²
Compared on the same 1,186 municipalities having both income and land price.
| Explanatory variables | R² |
|---|---|
| Population only | 0.9101 |
| Population + income | 0.9104 |
| Population + land price | 0.9132 |
| Population + income + land price | 0.9171 |
| Population + income + land price + population change | 0.9236 |
Adding all three raises R² by 0.0135.
3-3 Prefecture matters more
Median residual by prefecture, for prefectures with at least 10 municipalities.
| Highest | Median | Municipalities |
|---|---|---|
| Fukui | +15.0 | 17 |
| Hiroshima | +14.9 | 30 |
| Yamanashi | +13.5 | 27 |
| Ishikawa | +12.4 | 19 |
| Shimane | +12.0 | 19 |
| Lowest | Median | Municipalities |
|---|---|---|
| Aomori | −13.3 | 40 |
| Kanagawa | −19.3 | 58 |
| Fukuoka | −20.7 | 72 |
| Okinawa | −23.4 | 41 |
The spread of 38.4 subcategories exceeds the residual standard deviation of 25.6.
Prefecture differences are larger than income, land price or population change.
Hokkaido is +1.0, ranking 25th of 47 — exactly in the middle.
3-4 The Kushiro Subprefecture
| Municipality | Population | Residual | Income (thousand yen) | Land price (yen/m²) | 5-year change |
|---|---|---|---|---|---|
| Kushiro City | 151,566 | +19.7 | 3,121.2 | 35,140 | −8.51% |
| Kushiro Town | 18,021 | −11.5 | 2,971.0 | 56,500 | −7.07% |
| Akkeshi | 7,976 | +13.2 | 3,310.8 | — | −12.00% |
| Hamanaka | 5,172 | −16.4 | 3,460.0 | — | −8.69% |
| Shibecha | 6,698 | −5.6 | 3,364.9 | — | −9.79% |
| Teshikaga | 6,327 | +7.8 | 3,415.9 | — | −8.79% |
| Tsurui | 2,368 | −4.6 | 3,357.2 | — | −6.03% |
| Shiranuka | 6,840 | −6.8 | 2,665.6 | — | −9.27% |
Six of the eight have no commercial land price, no standard site being located there.
The highest income is in Hamanaka (3,460.0), which also has the lowest residual (−16.4): higher income is not accompanied by more subcategories.
Kushiro Town's land price (56,500) exceeds Kushiro City's (35,140). This presumably reflects where standard sites happen to be placed in a city centre versus an adjacent town, but that has not been verified.
4. Discussion
4-1 A negative result
The finding of this paper is that the residual was not explained. Income, land price and population change all fail.
This does not narrow the usefulness of the residual; it clarifies it. The residual is not a restatement of residents' wealth.
What population leaves unexplained is something else.
4-2 "Where" matters more
The prefecture spread (38.4 subcategories) exceeds any of the three variables.
The residual therefore contains a component arising from regional grouping.
That Kanagawa (−19.3) and Fukuoka (−20.7) sit near the bottom may relate to unit A splitting designated cities into wards.
A ward is part of a city, and if functions are divided across wards, each ward shows fewer subcategories than the city as a whole. This hypothesis can be tested with unit B (designated cities counted as one); it is not tested here.
For Okinawa (−23.4) no explanation is offered.
4-3 What to look at next
Candidates not tried here include the ratio of daytime to nighttime population, the size of neighbouring municipalities, road and rail connections, and industrial history.
All concern how a municipality is connected to what surrounds it. The result in 3-3 points that way.
5. Limitations
- Establishments are from 2021, population from 2026, income from FY2025 and land prices from 2026: the reference dates do not align
- Municipalities without a commercial standard site drop out of the land-price analysis, and the missingness is concentrated among small municipalities
- Prefecture medians depend on the composition of municipalities within each prefecture, including whether wards of designated cities are counted
- Correlation and regression describe association, not the direction of causation
- A positive residual does not mean prosperity, nor a negative one opportunity
6. Reproduction
- Compute the residual of the population-only fit as in R001
- Take taxable income per taxpayer from the Survey of Municipal Taxation
- Build municipal mean commercial land prices from the Land Price Publication (National Land Numerical Information)
- Join on the municipality code; compute correlations and the R² of successive specifications
- Take the median residual by prefecture
All values are the output of a single script (kensan_187). No intermediate value was transcribed by hand.
References and data sources
- Statistics Bureau of Japan and METI, 2021 Economic Census for Business Activity.
- MIC, Population Based on the Basic Resident Register, 1 January 2026.
- MIC, Survey of Municipal Taxation, FY2025.
- MLIT, Land Price Publication 2026 (National Land Numerical Information).
- Y. Yamagishi, "Population and the Number of Industrial Subcategories Present in Japanese Municipalities" (R001). Zenodo. https://doi.org/10.5281/zenodo.22872218
Items 1–4 are published on e-Stat and on the ministries' websites.
Version history
| Version | Date | Change |
|---|---|---|
| 1 | 2026-09-21 | First release |
How to cite
Yamagishi, Y. (2026). What Population Leaves Unexplained Is Not Explained by Income or Land Prices — Prefecture Matters More [R004]. Zenodo. https://doi.org/10.5281/zenodo.22872530
(This DOI is the concept DOI; it always resolves to the latest version. Cite this one.)
© 2026 Yuuki YAMAGISHI
This work is licensed under a Creative Commons Attribution 4.0 International License (CC BY 4.0).
You may copy, adapt, redistribute and use it commercially, provided you give appropriate credit.
creativecommons.org/licenses/by/4.0
All figures and values in this paper were computed from official statistics. Rights in the underlying data remain with the publishing agencies.
Reference
Yamagishi, Y. (2026). What Population Leaves Unexplained Is Not Explained by Income or Land Prices [R004]. Zenodo.
DOI: 10.5281/zenodo.22872530
YOI: https://www.yamagishiyuuki.com/yoi/R004
ORCID: 0009-0006-8587-3450
PDF (English) · PDF (Japanese) · Date proof of the English PDF (OpenTimestamps .ots) · SHA256SUMS
The record page for this paper (in Japanese, with the PDFs in each language and the date proof): YOI R004. This paper is a preprint and has not been peer reviewed.