Abstract
What this paper asks is how much an indicator's answer changes when bars are, or are not, created for slots with no ticks. No new mathematical theorem and no new law is claimed.
First, ★ the missing slots are 0.0234 of hourly bars, and 0.0369 for gold. And prediction ① failed: they cluster on particular days, not particular hours (20 on 2021-05-31, 19 on 2020-11-30, 14 on 25 December) (Section 3).
Second, ★ the values barely move. The median difference in the moving average is 0.0000 pips at all three periods. Only 0.0835 to 0.1754 of bars have a missing slot inside their window at all (Section 4).
Third, ★ the verdicts move even less. Whether the price is above or below the moving average disagrees on 0.0061 of bars at periods 20, 50 and 200 alike. Whether RSI exceeds 70 disagrees on 0.0031 (Section 5).
Fourth, and this is the core of the paper: ★★ the counts do move. The number of crosses between the 20- and 80-period moving averages rises by 1.0140 to 1.0587 times (median 1.0238) (Section 6).
Fifth, ★★ ATR too does nothing at the median and breaks at the edge. The median ratio is 1.0000, yet median against median is 0.9732, the mean ratio is 0.9824, and in the worst window it is 0.0690 (Section 5).
Sixth, ★ none of this is a property of the market. On a synthetic random walk the ATR ratio is the same 1.0000 at the median (Section 7).
Scope of this paper: no new mathematical theorem and no new law is claimed — that the treatment of missing data moves an indicator is itself known. No real course, author, or vendor is the subject here, and none is named. No particular trading software is discussed — which package builds bars which way was not examined (Section 7). No trading is discussed — neither performance nor profit and loss is measured. Predictions ① and ④ failed — ① misread where the missing slots are (Sections 3 and 5). One way of filling is fixed — the previous close, and gaps of 24 hours or more are not filled (Section 7). The scope is intraday and few instruments — four instruments over six years. Results documented at longer holding periods, such as monthly time-series momentum, are not contradicted. No prediction is claimed.
1. Notation and the question
Foreign exchange has slots in which no quote is updated. Whether a bar is created for such a slot is a difference between implementations, not a property of the market.
| What gets said | What does not get said |
|---|---|
| The 20-period average crossed above | Whether those 20 included a bar that did not move |
| ATR was 15 pips | How many of those fourteen were slots with no ticks |
| We are looking at the same chart | The number of bars need not be the same |
Observation 1.1: ★ Create them and one motionless bar is added; do not, and the bars close up. Both are looking at the same market.
Observation 1.2: ★ That a candle's shape belongs to the way the bars were cut was measured in [F020]. What this paper varies is not the cutting but whether a bar is placed where the cut falls.
Observation 1.3: The separator here is whether a bar was created for a slot with no ticks. The instruments, the period, the grid and the indicators are all held fixed, and only whether the bar is placed is changed.
Question: how different are the values, how many verdicts disagree, and what happens to the counts?
2. State the quantities and the design first
Declared before the run and unchanged during it.
| Grid | 5 min / 15 min / 1 hour (mid price, completed bars only) |
| A, do not create | Slots with no ticks are skipped (this series' usual construction) |
| B, create | Only gaps under 24 hours are filled with the previous close (open = high = low = close) |
| Indicators | SMA 20 / 50 / 200, RSI 14 (Wilder smoothing), ATR 14 |
| Verdicts | Whether the price is above or below the SMA / whether RSI exceeds 70 |
| Crosses | The number of crossings between the 20- and 80-period SMA |
| Comparison | ★ Only at the timestamps that exist in A |
| Baseline | Synthetic random walk down to within the bar (3 draws, with the missing slots left where they really are) |
| Separator | Whether a bar was created for a slot with no ticks |
| Instruments and period | USDJPY, EURUSD, GBPUSD, XAUUSD / 2019–2024 |
Observation 2.1: ★ Weekends are not filled. The rule is that gaps of 24 hours or more are left alone, because trading software does not create weekend bars either.
Observation 2.2: ★ The comparison runs only over timestamps present in A. B always has that slot, so the two can be matched at the same wall-clock time.
Observation 2.3: The hourly series goes from 36,534 bars to 37,415 (USDJPY). The 5-minute series goes from 438,283 to 448,934.
Predictions (written before measuring)
① The missing slots cluster in the thin hours.
② ★ The longer the indicator's period, the longer the difference persists.
③ ★ The verdicts disagree less than the values differ, because the price is usually well away from the average.
④ ★★ ATR falls. Adding a bar that did not move puts a zero range into the average.
⑤ The count of moving-average crosses changes.
⑥ A synthetic random walk differs by the same amount.
3. How many slots are missing, and when
Calculation 3.1 By bar size (median of the four instruments)
| Bar size | Version A | Version B | Slots filled | Share |
|---|---|---|---|---|
| 5m | 438,241 | 448,868 | 10,627 | 0.0237 |
| 15m | 146,126 | 149,635 | 3,509 | 0.0235 |
| 1h | 36,534 | 37,410 | 875 | 0.0234 |
Observation 3.2: ★ The share is almost the same at every bar size (0.0234 to 0.0237). Only gold is higher at 0.0369 (0.0374 on 5-minute, 0.0373 on 15-minute).
Calculation 3.3 When are they missing? (USDJPY, hourly)
| Date | Slots filled |
|---|---|
| 2021-05-31 | 20 |
| 2020-11-30 | 19 |
| 2024-12-25 | 14 |
| 2019-12-25 | 14 |
| 2023-12-25 | 14 |
| 2024-10-31 | 8 |
| 2024-10-22 | 8 |
| 2023-05-03 | 8 |
Observation 3.4: ★★ Prediction ① failed. They cluster on particular days, not particular hours. Month ends (20 on 2021-05-31, 19 on 2020-11-30) and Christmas (14 on 25 December).
Observation 3.5: By weekday, Monday at 0.0295 and Sunday at 0.0298 are high, and Friday at 0.0162 is low.
Observation 3.6: ★ By hour, 23:00 UTC peaks at 0.0429 while 0:00 to 3:00 UTC are 0.0000. ★ I nearly read that as "the thin hours", and it is the other way round: those hours are absent on the missing days, which is not a property of the hour.
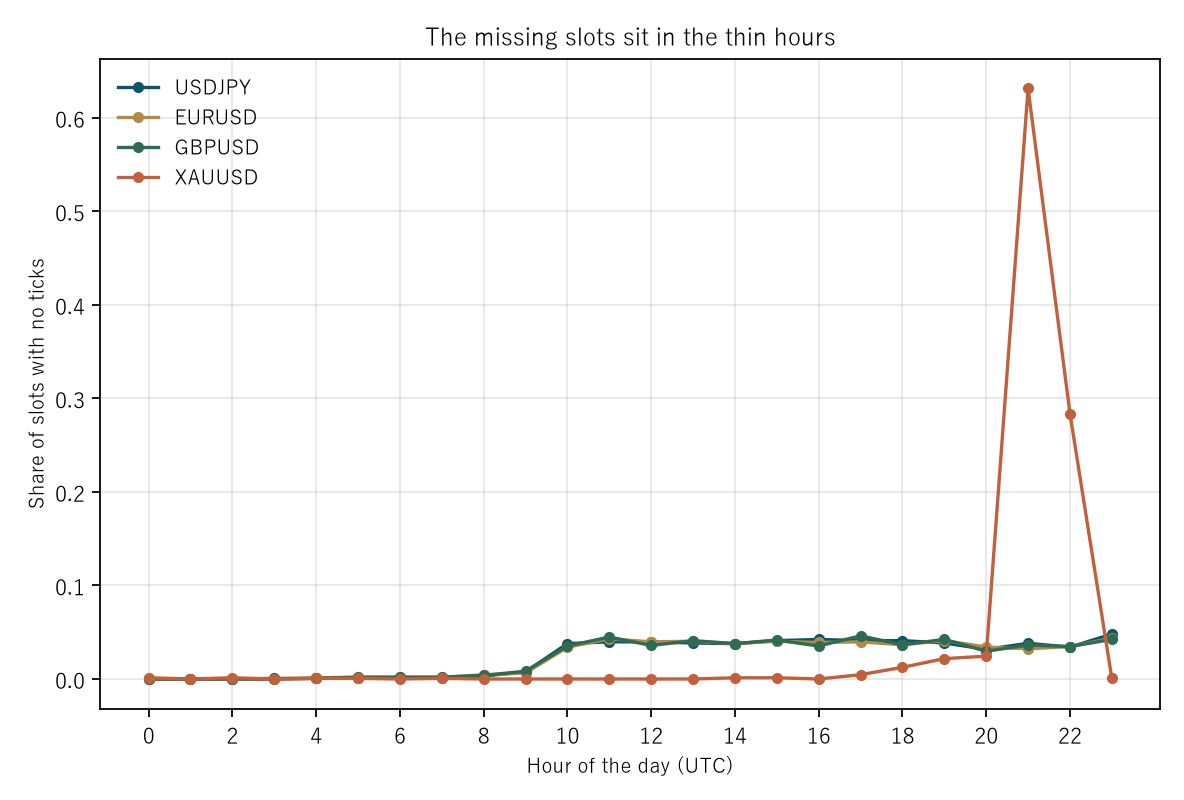
Figure 1: hour of the day (UTC) on the horizontal axis and the share of missing slots on the vertical. ★ The figure's title is left as prediction ① wrote it. The measurement shows it cannot be read that way.
4. The values barely move
Calculation 4.1 Difference in the moving average (hourly, pips, median of the four instruments)
| Period | Median difference | 99th pct | Maximum | Share of bars affected | Verdicts disagreeing |
|---|---|---|---|---|---|
| 20 | 0.0000 | 17.9142 | 55.3850 | 0.0835 | 0.0061 |
| 50 | 0.0000 | 22.5362 | 68.1035 | 0.1004 | 0.0061 |
| 200 | 0.0000 | 39.3752 | 77.0714 | 0.1754 | 0.0061 |
Observation 4.2: ★★ The median is 0.0000 pips at all three periods. Most bars simply have no missing slot inside their window.
Observation 4.3: Prediction ② held. ★ The share of bars affected rises from 0.0835 to 0.1754, because a longer window has more chances to contain a missing slot.
Observation 4.4: ★ At the edge it is large, though. The 99th percentile runs from 17.9142 to 39.3752 pips, and the maximum from 55.3850 to 77.0714 pips.
Observation 4.5: ★ So "nothing at the median and large at the edge". That is the same shape measured for ATR in [F047].
5. The verdicts move even less. ATR breaks at the edge
Calculation 5.1 RSI and ATR (hourly, median of the four instruments)
| Quantity | Value |
|---|---|
| Median difference in RSI | 0.0000 |
| 99th percentile of the difference in RSI | 4.6025 |
| Maximum difference in RSI | 18.6025 |
| Verdicts disagreeing on RSI above 70 | 0.0031 |
| Median ATR, version A (pips) | 15.8304 |
| Median ATR, version B (pips) | 15.4696 |
| Median against median | 0.9732 |
| Median of the ratio | 1.0000 |
| Mean of the ratio | 0.9824 |
| Minimum of the ratio | 0.0690 |
Observation 5.2: Prediction ③ held. ★ The moving average differs by up to 77.0714 pips, and the verdicts disagree on only 0.0061 of bars. RSI differs by up to 18.6025, and the 70 verdict disagrees on 0.0031.
Observation 5.3: ★ That the disagreement is 0.0061 at periods 20, 50 and 200 alike reads as the disagreement being made by the missing slots themselves rather than by the window length. This paper does not measure that directly, however.
Observation 5.4: ★★ Prediction ④ half failed. The median of the ATR ratio is 1.0000 and does not move. But median against median is 0.9732 and the mean ratio is 0.9824, so it does fall.
Observation 5.5: ★★ And in the worst window it is 0.0690. There really are windows where nearly all fourteen bars have a zero range. ATR there is under a fourteenth of itself.
Observation 5.6: ★ Look at the median and nothing is happening; look at the edge and it is a fourteenth. The same single quantity.
6. But the counts do move
Calculation 6.1 Crossings between the 20- and 80-period SMA
| Instrument | Bar size | Version A | Version B | Difference | Ratio |
|---|---|---|---|---|---|
| USDJPY | 5m | 7,071 | 7,249 | +178 | 1.0252 |
| USDJPY | 15m | 2,270 | 2,313 | +43 | 1.0189 |
| USDJPY | 1h | 550 | 560 | +10 | 1.0182 |
| EURUSD | 5m | 7,055 | 7,202 | +147 | 1.0208 |
| EURUSD | 15m | 2,331 | 2,414 | +83 | 1.0356 |
| EURUSD | 1h | 555 | 565 | +10 | 1.0180 |
| GBPUSD | 5m | 7,091 | 7,250 | +159 | 1.0224 |
| GBPUSD | 15m | 2,305 | 2,369 | +64 | 1.0278 |
| GBPUSD | 1h | 573 | 581 | +8 | 1.0140 |
| XAUUSD | 5m | 6,672 | 6,972 | +300 | 1.0450 |
| XAUUSD | 15m | 2,215 | 2,341 | +126 | 1.0569 |
| XAUUSD | 1h | 528 | 559 | +31 | 1.0587 |
Observation 6.2: ★★ This is the core of the paper. Prediction ⑤ held: the ratio has a median of 1.0238 and a range of 1.0140 to 1.0587.
Observation 6.3: ★★ The median difference in value is 0.0000 and the verdicts disagree on 0.0061, yet all twelve combinations show more crosses. Not one shows fewer.
Observation 6.4: ★ A plausible reading is that the filled bars flatten the line and raise the number of times it wanders across zero. The mechanism is not measured here.
Observation 6.5: ★ Gold is the largest (1.0450 on 5-minute, 1.0569 on 15-minute, 1.0587 on hourly). That runs the same way as its 0.0369 share of missing slots.
Observation 6.6: ★ So two packages showing the same 20 and 80 crosses on the same data can differ by 1.0140 to 1.0587 times on "how many crosses there were".
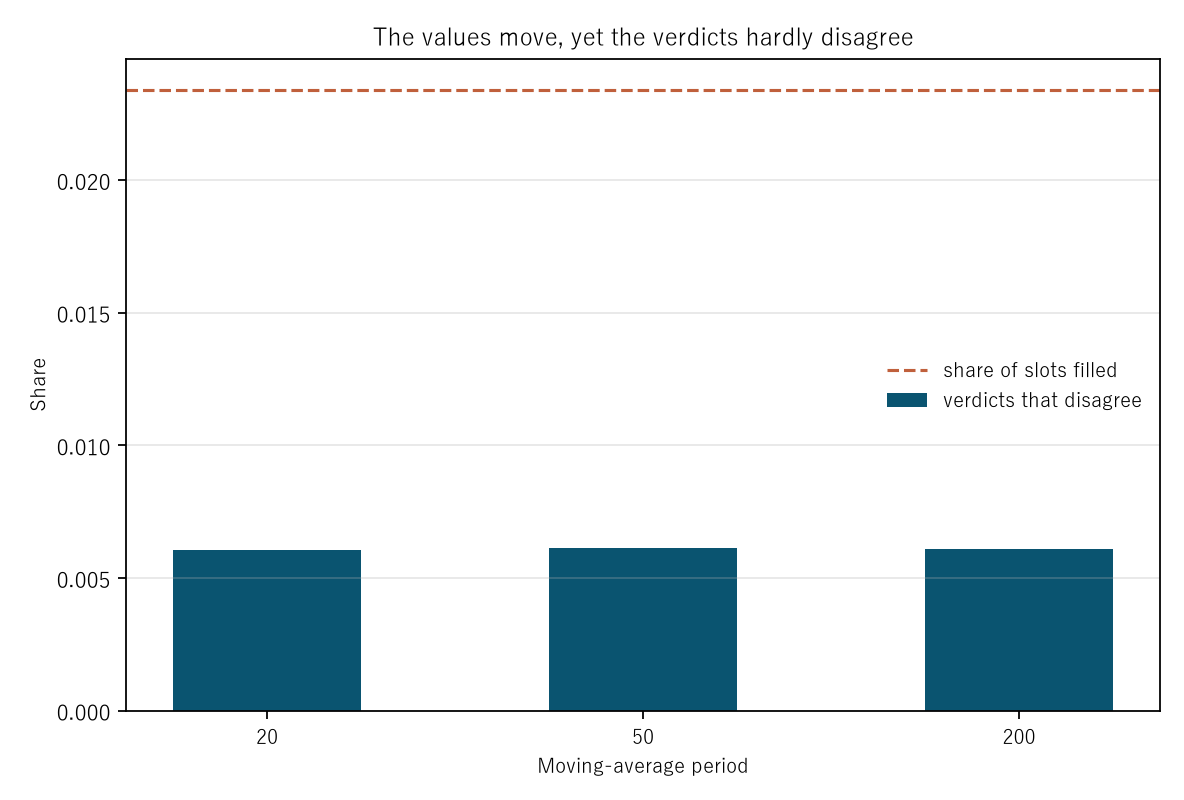
Figure 2: moving-average period on the horizontal axis and a share on the vertical. The bars are the verdicts that disagree and the dashed line is the share of slots filled.
7. The baseline and limitations
Calculation 7.1 The same procedure on a synthetic random walk (hourly)
| Instrument | Measured SMA200 difference | Random walk | Measured ATR ratio | Random walk's ATR ratio |
|---|---|---|---|---|
| USDJPY | 0.0000 | 0.0000 | 1.0000 | 1.0000 |
| EURUSD | 0.0000 | 0.0000 | 1.0000 | 1.0000 |
| GBPUSD | 0.0000 | 0.0000 | 1.0000 | 1.0000 |
| XAUUSD | 5.8942 | 7.3836 | 1.0000 | 1.0000 |
Observation 7.2: Prediction ⑥ held. The ATR ratio has a median of 1.0000 for both the measurement and the random walk.
Observation 7.3: ★ The missing slots are left where they really are, and only the price movement is replaced. That the answer comes out the same means this is not a property of the market but of the calendar and the implementation.
Observation 7.4: ★ Only gold has a non-zero median difference in SMA200 (measured 5.8942, random walk 7.3836). It has enough missing slots that even the median bar's window contains one.
Observation 7.5: ★ What this baseline is zero about was measured in [F033].
Limitations
- Prediction ① got the location wrong. I read the missing slots as "the thin hours"; they cluster on month ends, Christmas and holidays. The table by hour looks that way only because those hours are absent on the missing days.
- Prediction ④ half failed too. The median of the ATR ratio did not move from 1.0000.
- One way of filling is fixed: the previous close, with gaps of 24 hours or more left alone. Another way gives another answer.
- No particular trading software is discussed. Which package builds bars which way was not examined.
- The mechanism behind the extra crosses is not measured. Flattened bars raising the wandering is only a reading.
- Why the verdict disagreement does not depend on the period is not measured either.
- Four instruments, six years. Nothing is claimed about other markets or other periods.
Conclusion
Whether a bar is created for a slot with no ticks is a difference between implementations, not a property of the market. The same market, the same indicator.
★ The missing slots are 0.0234 of hourly bars, and 0.0369 for gold. And they cluster not on hours but on month ends, Christmas and holidays (20 on 2021-05-31, 19 on 2020-11-30, 14 on 25 December). I nearly read them as "the thin hours" and was wrong.
★ The values barely move. The median difference in the moving average is 0.0000 pips at all three periods, because only 0.0835 to 0.1754 of bars have a missing slot inside their window.
★ The verdicts move even less. Above or below disagrees on 0.0061 at periods 20, 50 and 200 alike, and RSI above 70 on 0.0031. A difference of up to 77.0714 pips does not flip which side the price is on.
★★ But the counts do move. The number of crosses between the 20- and 80-period averages rises by 1.0140 to 1.0587 times (median 1.0238), and all twelve combinations rise — not one falls.
★★ ATR has the same shape. The median ratio is 1.0000 and nothing happens, while in the worst window it is 0.0690 — under a fourteenth.
★ None of this is a property of the market. On a synthetic random walk the ATR ratio is the same 1.0000 at the median. It belongs to the calendar and the implementation.
So matching indicator values and concluding "they agree" is not enough. ★ The counts have to be checked separately. Where nothing is happening at the median, the count is 1.0587 times larger and ATR is 0.0690 of itself.
Data and reproduction
| Data | Foreign exchange from Dukascopy-derived ticks (from 2019 onward, matching to the millisecond, bid and ask, has been verified). Gold from Dukascopy |
| Period | 2019–2024 (six years) |
| Instruments | USDJPY, EURUSD, GBPUSD, XAUUSD |
| Bars | 5 min, 15 min, 1 hour, mid price, completed bars only |
| A, do not create | Slots with no ticks are skipped |
| B, create | Only gaps under 24 hours are filled with the previous close (open = high = low = close, zero range) |
| Indicators | SMA 20, 50, 200 / RSI 14 (Wilder smoothing) / ATR 14 |
| Verdicts | Whether the price is above or below the SMA / whether RSI exceeds 70 |
| Crosses | The number of crossings between the 20- and 80-period SMA |
| Comparison | Only at the timestamps that exist in A |
| Baseline | Synthetic random walk down to within the bar (3 draws), with the missing slots left where they really are |
| Verification | 検算/F049.py (--zu also writes the figures). Every number in the text comes from 検算/F049_output.txt |
| Figures | 図/F049_zu1, 図/F049_zu2 (png, svg, English versions) |
| Random seeds | Fixed. Re-running gives the same values |
| Substrate check | _ツール/audit_bars.py (bar look-ahead, daylight saving, day boundary). The record is _土台の検査.txt |
References
- Yamagishi, Y. (2026). Candlestick Shapes Belong to the Way the Bars Were Cut [F020]. Zenodo. 10.5281/zenodo.22891997
- Yamagishi, Y. (2026). A Synthetic Random Walk Has No Volatility Clustering [F033]. Zenodo. 10.5281/zenodo.22893674
- Yamagishi, Y. (2026). The "True Range" in ATR Is, Most of the Time, Just the Range [F047]. Zenodo. 10.5281/zenodo.22896724
Reference
Yamagishi, Y. (2026). Create Bars for the Empty Slots and the Values Stay Put While the Counts Move [F049]. Zenodo.
DOI: 10.5281/zenodo.22897116
YOI: https://www.yamagishiyuuki.com/yoi/F049
ORCID: 0009-0006-8587-3450
PDF (English) · PDF (Japanese) · Date proof of the English PDF (OpenTimestamps .ots) · SHA256SUMS
The record page for this paper (in Japanese, with the PDFs in each language and the date proof): YOI F049. This paper is a preprint and has not been peer reviewed.