Abstract
What this paper asks is how much the shape of returns is made by what a bar was cut on. No new mathematical theorem and no new law is claimed.
First, ★ what was held constant and what was left to chance swap over cleanly. Minute bars vary by only 1.31 in duration but by 10.38 in tick count; tick bars vary by 1.00 in tick count (by construction) and by 7.04 in duration (Section 3).
Second, ★★ the fat tail halves with the cut. Excess kurtosis is 120.2788 for minute bars and 61.3744 for tick bars, a factor of 1.9598 (Section 4).
Third, ★★ volatility clustering halves too. The lag-1 autocorrelation of \|return\| goes from 0.3077 to 0.1767, a factor of 0.5743 (Section 5).
Fourth, and this is the core of the paper: ★★ the baseline settles it. A synthetic random walk whose true values are normal and uncorrelated shows an excess kurtosis of 2.2459 and an autocorrelation of 0.1812 when cut into minute bars. Cut by tick count it returns to −0.0007 and −0.0001 (Section 7).
Fifth, ★ the hour-of-day bias is not absorbed; it is brought out as a count. Minute bars vary by only 1.0647 across hours, while tick bars vary by 6.7105 (Section 6).
Sixth, ★ the spread of the moves was already measured in [F018]. What this paper adds is the kurtosis, the autocorrelation and the baseline (Sections 4 and 7).
Scope of this paper: no new mathematical theorem and no new law is claimed — time change and subordinated processes are classical subjects. No real course, author, or vendor is the subject here, and none is named. No trading is discussed — neither performance nor profit and loss is measured. The spread of the moves overlaps [F018] — what this paper adds is the kurtosis, the autocorrelation and the baseline (Section 4). Two ways of cutting are fixed — the clock and the tick count (Section 7). No bar is created for a slot with no ticks — that this convention moves the answer was measured in [F049] (Section 7). The scope is intraday and few instruments — four instruments over six years. Results documented at longer holding periods, such as monthly time-series momentum, are not contradicted. No prediction is claimed.
1. Notation and the question
To make a bar, something has to be held constant.
| Held constant | Left to chance | Called |
|---|---|---|
| Time | The number of ticks inside a bar | A minute bar |
| The number of ticks | The time a bar takes | A tick bar |
Observation 1.1: ★ Both are called "a bar", and what was held constant differs.
Observation 1.2: ★ That bars cut by tick count are a different clock from bars cut by the clock was measured in [F018]. What was measured there was the spread of the moves. What this paper measures is the shape of the returns.
Observation 1.3: The separator here is what the bar was cut on. The instruments, the period and the sequence of ticks are all held fixed, and only the way of cutting is changed.
Question: how much of the fat tail and the volatility clustering does the way of cutting make?
2. State the quantities and the design first
Declared before the run and unchanged during it.
| A, minute bars | Every 60,000 milliseconds. No bar is created for a slot with no ticks |
| B, tick bars | Every N ticks. ★ N = total ticks ÷ the number of minute bars (so the counts match) |
| Returns | The difference between closes, in pips |
| Kurtosis | Excess kurtosis (0 if normal) |
| Autocorrelation | Lag 1 of |return| |
| Hour | UTC, counted at the bar's closing time |
| Baseline | Synthetic random walk down to the tick (3 draws). ★ The times and the sequence of ticks are left as measured |
| Separator | What the bar was cut on (the clock, or the number of ticks) |
| Instruments and period | USDJPY, EURUSD, GBPUSD, XAUUSD / 2019–2024 |
Observation 2.1: ★ Matching the counts is the point. Without that, the comparison is only "one is finer than the other".
Observation 2.2: N is 86 ticks for USDJPY, 76 for EURUSD, 80 for GBPUSD and 151 for XAUUSD. The counts are 2,181,459, 2,181,955, 2,182,565 and 2,090,977 minute bars against 2,183,483, 2,184,429, 2,183,491 and 2,090,836 tick bars.
Observation 2.3: ★ In the baseline the times and the sequence of ticks are left as measured, and only the price movement is replaced. So "when and how many ticks arrived" is identical to the measurement.
Predictions (written before measuring)
① It comes out symmetric: cut by the clock and the tick count varies; cut by ticks and the duration varies.
② ★★ Tick bars' returns have the smaller kurtosis (closer to normal).
③ ★ Tick bars absorb the hour-of-day bias.
④ ★ The autocorrelation of \|return\| is weaker on tick bars.
⑤ On a synthetic random walk the gap in kurtosis between the two shrinks.
⑥ ★ The size of the move per bar is more uniform on tick bars.
3. What was held constant and what was left to chance
Calculation 3.1 Duration and tick count per bar (median of the four instruments)
| Bar type | Duration 10th pct | Duration median | Duration 90th pct | Duration spread | Ticks 10th pct | Ticks median | Ticks 90th pct | Tick spread |
|---|---|---|---|---|---|---|---|---|
| Minute bars | 45.5 | 57.5 | 59.6 | 1.31 | 16 | 63 | 172 | 10.38 |
| Tick bars | 16.5 | 42.3 | 115.6 | 7.04 | 83 | 83 | 83 | 1.00 |
Observation 3.2: Prediction ① held. ★ Minute bars vary by only 1.31 in duration while varying by 10.38 in tick count.
Observation 3.3: ★ Tick bars are the mirror image: 1.00 in tick count (by construction) and 7.04 in duration.
Observation 3.4: ★★ So the word "a bar" does not stand for the same amount of anything. One counts time, the other counts events.
4. The fat tail halves with the cut
Calculation 4.1 The shape of the returns (median of the four instruments)
| Bar type | Count | Mean |r| | Spread | Excess kurtosis | CV of |r| |
|---|---|---|---|---|---|
| Minute bars | 2,181,707 | 1.1360 | 1.9533 | 120.2788 | 1.2799 |
| Tick bars | 2,183,487 | 1.3248 | 1.9415 | 61.3744 | 0.9753 |
Observation 4.2: Prediction ② held. ★★ Excess kurtosis falls from 120.2788 to 61.3744, a factor of 1.9598.
Observation 4.3: Prediction ⑥ held too. The CV of \|r\| falls from 1.2799 to 0.9753. ★ [F018] measured the same quantity with the median duration matched instead, and it runs the same way — a check that a different construction gives the same answer.
Calculation 4.4 Excess kurtosis by instrument
| Instrument | Minute bars | Tick bars | Ratio |
|---|---|---|---|
| USDJPY | 219.2766 | 124.6253 | 1.7595 |
| EURUSD | 114.2092 | 51.3963 | 2.2221 |
| GBPUSD | 126.3484 | 71.3525 | 1.7708 |
| XAUUSD | 98.3260 | 50.9362 | 1.9304 |
Observation 4.5: ★ All four run between 1.7595 and 2.2221, so the direction agrees.
Observation 4.6: ★ Even on tick bars, however, it is 50.9362 to 124.6253 — nowhere near normal (0). What the cut removes is half.
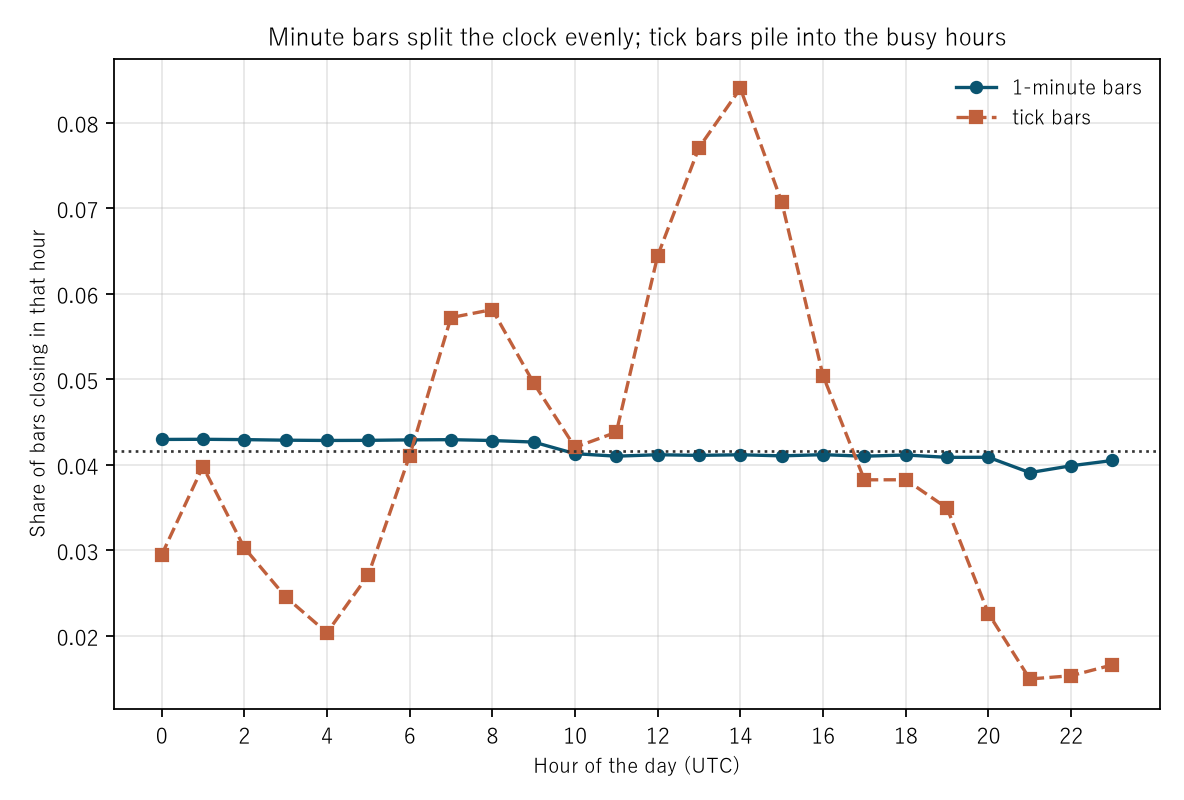
Figure 1: hour of the day (UTC) on the horizontal axis and the share of bars closing in that hour on the vertical. Circles are minute bars, squares tick bars, and the dotted line is one twenty-fourth.
5. The clustering halves too
Calculation 5.1 Lag-1 autocorrelation of \|return\|
| Instrument | Minute bars | Tick bars | Ratio |
|---|---|---|---|
| USDJPY | 0.3280 | 0.2178 | 0.6639 |
| EURUSD | 0.2858 | 0.1405 | 0.4915 |
| GBPUSD | 0.2930 | 0.1758 | 0.5999 |
| XAUUSD | 0.3223 | 0.1776 | 0.5511 |
| Median of the four | 0.3077 | 0.1767 | 0.5743 |
Observation 5.2: Prediction ④ held. ★★ The autocorrelation falls from 0.3077 to 0.1767, a factor of 0.5743.
Observation 5.3: ★ All four run between 0.4915 and 0.6639, so the direction agrees.
Observation 5.4: ★ Here too, half remains on tick bars. The clustering does not disappear.
6. The hour-of-day bias is not absorbed; it is brought out
Calculation 6.1 Share of bars by hour (median of the four instruments)
| Hour (UTC) | Minute bars | Tick bars | Hour (UTC) | Minute bars | Tick bars |
|---|---|---|---|---|---|
| 0 | 0.0430 | 0.0295 | 12 | 0.0412 | 0.0645 |
| 1 | 0.0430 | 0.0398 | 13 | 0.0411 | 0.0771 |
| 2 | 0.0430 | 0.0303 | 14 | 0.0412 | 0.0840 |
| 3 | 0.0429 | 0.0246 | 15 | 0.0411 | 0.0707 |
| 4 | 0.0429 | 0.0204 | 16 | 0.0412 | 0.0504 |
| 5 | 0.0429 | 0.0271 | 17 | 0.0410 | 0.0383 |
Observation 6.2: Prediction ③ held. The spread is 1.0647 for minute bars against 6.7105 for tick bars (a factor of 6.3027).
Observation 6.3: ★★ But "absorb" is the wrong word. Tick bars bring the hour-of-day bias out as a bias in the count. The most crowded hour is 14:00 UTC (0.0840) and the emptiest is 21:00 (0.0150).
Observation 6.4: ★ That minute bars vary by only 1.0647 follows from splitting the clock evenly. They are not unbiased; they make the bias invisible.
7. ★ The baseline settles it — on a random walk the clock still makes tails and clustering
Calculation 7.1 Replacing only the price movement with a synthetic random walk
| Bar type | Measured kurtosis | Random walk's kurtosis | Measured autocorrelation | Random walk's autocorrelation |
|---|---|---|---|---|
| Minute bars | 120.2788 | 2.2459 | 0.3077 | 0.1812 |
| Tick bars | 61.3744 | −0.0007 | 0.1767 | −0.0001 |
Observation 7.2: ★★ This is the core of the paper. The random walk's true values are normal (kurtosis 0) and uncorrelated (autocorrelation 0). Cut by tick count, that is exactly what comes out: −0.0007 and −0.0001.
Observation 7.3: ★★ Cut the same random walk into minute bars, and an excess kurtosis of 2.2459 and an autocorrelation of 0.1812 appear. Fat tails and volatility clustering out of nothing at all.
Observation 7.4: ★★ What makes them is that the number of ticks in a minute differs by hour. Mix minutes with few ticks and minutes with many, and the return distribution moves away from normal and neighbours start to resemble one another.
Observation 7.5: Prediction ⑤ held. The gap in kurtosis (minute minus tick) is 58.9044 measured and 2.2466 on the random walk.
Observation 7.6: ★ So of the measured kurtosis of 120.2788, what the clock makes is not only 2.2459. What changing the cut removes is 58.9044, and inside that sits the 2.2466 that appears even on a random walk. The rest belongs to the market.
Observation 7.7: ★ That a synthetic random walk has no volatility clustering was measured in [F033]. What this paper adds is that a series with no clustering still shows an autocorrelation of 0.1812 when read on minute bars.
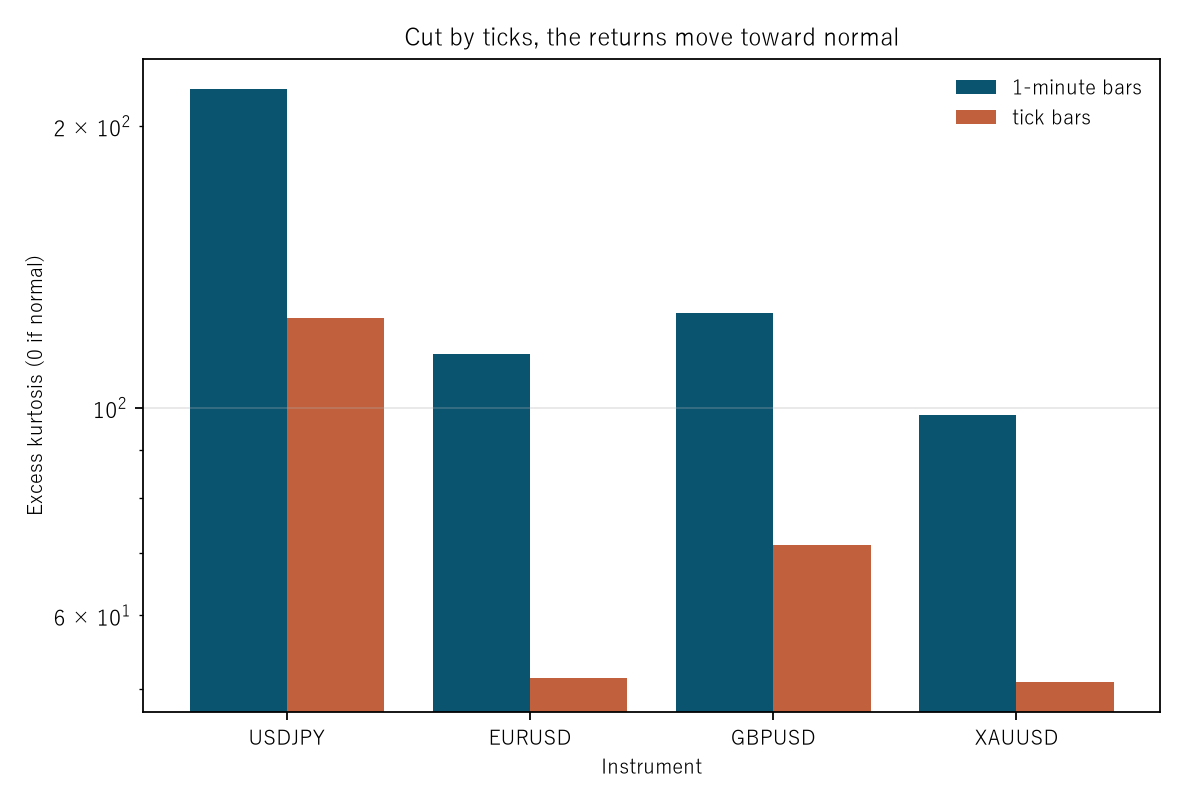
Figure 2: instrument on the horizontal axis and excess kurtosis on the vertical (logarithmic). Left is minute bars, right tick bars.
Limitations
- Two ways of cutting are fixed: the clock and the tick count. Volume bars and renko are not included.
- One way of matching the counts is fixed: total ticks ÷ the number of minute bars.
- No bar is created for a slot with no ticks. That this convention moves the answer was measured in [F049].
- The spread of the moves overlaps [F018]. What this paper adds is the kurtosis, the autocorrelation and the baseline.
- The clock's share and the market's share are not cleanly separated. All that is said is that the 2.2466 of the random walk sits inside the gap of 58.9044.
- No trading is discussed. Neither performance nor profit and loss is measured.
- Four instruments, six years. Nothing is claimed about other markets or other periods.
Conclusion
To make a bar, something has to be held constant. Minute bars hold time constant; tick bars hold the number of ticks constant.
★ What is held constant and what is left to chance swap over cleanly. Minute bars: duration spread 1.31, tick spread 10.38. Tick bars: tick spread 1.00, duration spread 7.04.
★★ And the fat tail halves with the cut. Excess kurtosis goes from 120.2788 to 61.3744 (a factor of 1.9598), with all four instruments running the same way.
★★ The volatility clustering halves too. The autocorrelation goes from 0.3077 to 0.1767 (a factor of 0.5743).
★★ The baseline settles it. A synthetic random walk whose true values are normal and uncorrelated shows an excess kurtosis of 2.2459 and an autocorrelation of 0.1812 when cut into minute bars, and returns to −0.0007 and −0.0001 when cut by ticks. Out of nothing at all, the clock makes tails and clustering.
★ What makes them is that the number of ticks in a minute differs by hour. Tick bars run from 0.0840 at 14:00 UTC to 0.0150 at 21:00, a spread of 6.7105, and minute bars show that as 1.0647.
★ What the cut removes, though, is half. Even on tick bars the kurtosis is 50.9362 to 124.6253, far from normal. The rest belongs to the market.
So when saying "minute-bar returns have fat tails and volatility clusters", the clock's share has to be separated out. ★ Even a series whose true value is zero shows 2.2459 and 0.1812 when read on minute bars.
Data and reproduction
| Data | Foreign exchange from Dukascopy-derived ticks (from 2019 onward, matching to the millisecond, bid and ask, has been verified). Gold from Dukascopy |
| Period | 2019–2024 (six years) |
| Instruments | USDJPY, EURUSD, GBPUSD, XAUUSD |
| A, minute bars | Every 60,000 milliseconds. No bar is created for a slot with no ticks |
| B, tick bars | Every N ticks. N = total ticks ÷ the number of minute bars, per instrument and year |
| Returns | The difference between closes, in pips |
| Kurtosis | Excess kurtosis (0 if normal) |
| Autocorrelation | Lag 1 of |return| |
| Hour | UTC, counted at the bar's closing time |
| Baseline | Synthetic random walk down to the tick (3 draws). The times and spreads are left as measured |
| Verification | 検算/F050.py (--zu also writes the figures). Every number in the text comes from 検算/F050_output.txt |
| Figures | 図/F050_zu1, 図/F050_zu2 (png, svg, English versions) |
| Random seeds | Fixed. Re-running gives the same values |
| Substrate check | _ツール/audit_bars.py (bar look-ahead, daylight saving, day boundary). The record is _土台の検査.txt |
References
- Yamagishi, Y. (2026). Bars Cut by Tick Count Are a Different Clock from Bars Cut by the Clock [F018]. Zenodo. 10.5281/zenodo.22891916
- Yamagishi, Y. (2026). A Synthetic Random Walk Has No Volatility Clustering [F033]. Zenodo. 10.5281/zenodo.22893674
- Yamagishi, Y. (2026). Create Bars for the Empty Slots and the Values Stay Put While the Counts Move [F049]. Zenodo. 10.5281/zenodo.22897116
Reference
Yamagishi, Y. (2026). The Fat Tails and Volatility Clustering of Minute Bars Are Half an Artefact of the Clock [F050]. Zenodo.
DOI: 10.5281/zenodo.22897369
YOI: https://www.yamagishiyuuki.com/yoi/F050
ORCID: 0009-0006-8587-3450
PDF (English) · PDF (Japanese) · Date proof of the English PDF (OpenTimestamps .ots) · SHA256SUMS
The record page for this paper (in Japanese, with the PDFs in each language and the date proof): YOI F050. This paper is a preprint and has not been peer reviewed.