Abstract
From Tables 11 and 12-1 of the Report on Public Health Administration (FY2024) I counted food sampling tests by type of food and by prefecture, and set them against the food business counts of I011 and the inspector counts of I018.
95,546 samples were taken and 431 failed (0.45%) — one in 222.
Against 2,769,361 food businesses (all licensed plus notified), 95,546 samples is one per 29.0 establishments. Divided among 8,558 food sanitation inspectors, it is 11.2 samples each a year.
90.9% are tested in the authority's own institutions (public health centres, prefectural institutes of public health). 8.1% go to registered testing bodies.
Failure rates differ sharply by type of food. Ice cream and frozen confections 3.38%, confectionery 1.21%; eight of the 22 types had no failures at all. The median is 0.13%.
The largest single reason for failure is "other" at 247 (51.1%), followed by coliforms at 173 (35.8%). Foreign matter accounts for zero.
Samples per 100,000 population run from 209.7 in Nagasaki to 16.1 in Saitama, a spread of 13.05. Failure rates run from 3.08% in Kochi down to zero in seven prefectures.
And the correlation between sampling density and failure rate is r = −0.031. Prefectures that sample more do not find more failures.
1. Introduction
I014 found on-site inspection rates for medicines retail running from 91.6% in Nagano to 4.1% in Nara, a spread of 22.1. I016 found milk sampling at 2,593 samples against 3,569,411 kilolitres processed. I018 found 8,558 food sanitation inspectors (1,372 full time) against 2,769,361 food businesses.
All of those are about how much was examined, not about what the examination found.
How much food is examined, and what turns up when it is?
2. Data
| Sampling tests by type of food | MHLW, Report on Public Health Administration, FY2024, Table 11 (Food Sanitation). During FY2024 |
| Sampling tests by prefecture | Same source, Table 12-1 |
| Food businesses | Same source, Tables 4-1 and 6-1 (counted in I011) |
| Food sanitation inspectors | Same source, Table 13 (counted in I018) |
| Population | MIC, Basic Resident Register, 1 January 2026 |
All 47 prefectures and all 22 types of food are present, and both reconcile exactly with the totals (95,546 samples, 431 failures; differences zero).
"Sampling" (shūkyo) means the administration taking food from a business, without payment, for testing.
3. Results
3-1 95,546 samples, 431 failures
| Samples taken | 95,546 |
| Failures | 431 (0.45%) |
| one in 222 |
| Comparison | |
|---|---|
| 2,769,361 food businesses (I011) ÷ 95,546 samples | one per 29.0 establishments |
| 95,546 samples ÷ 8,558 inspectors (I018) | 11.2 per person a year |
3-2 Nine tenths tested in-house
| Where tested | Samples | Share |
|---|---|---|
| Prefectural institute of public health | 34,962 | 36.6% |
| Public health centre | 33,151 | 34.7% |
| Other in-house | 18,780 | 19.7% |
| In-house (subtotal) | 86,893 | 90.9% |
| Registered testing body | 7,704 | 8.1% |
| Other external | 1,041 | 1.1% |
| Type of test (a sample may get several) | Count | Against samples |
|---|---|---|
| Bacteria | 53,299 | 55.8% |
| Food additives | 21,868 | 22.9% |
| Veterinary drug residues | 11,658 | 12.2% |
| Other physicochemical | 8,170 | 8.6% |
| Pesticide residues | 8,152 | 8.5% |
| Allergens | 2,146 | 2.2% |
| Other | 771 | 0.8% |
| Genetically modified food | 739 | 0.8% |
| Other microbiological | 561 | 0.6% |
| Viruses | 343 | 0.4% |
| Animal assay | 334 | 0.3% |
| Total | 108,041 | 1.13× |
Each sample receives 1.13 tests on average. More than half (55.8%) are bacteriological.
3-3 Failure rates differ sharply by type
| Type (the 20 with 100+ samples) | Samples | Failures | Rate |
|---|---|---|---|
| Ice cream and frozen confections | 1,717 | 58 | 3.38% |
| Confectionery | 9,171 | 111 | 1.21% |
| Water | 805 | 6 | 0.75% |
| Other foods | 19,002 | 128 | 0.67% |
| Frozen food eaten without heating | 698 | 4 | 0.57% |
| Fish and shellfish | 7,730 | 25 | 0.32% |
| Processed fish products (excl. canned/bottled) | 6,065 | 16 | 0.26% |
| Vegetables, fruit and products (same) | 18,543 | 48 | 0.26% |
| … | |||
| Canned and bottled foods | 1,445 | 0 | 0.00% |
| Utensils and packaging | 557 | 0 | 0.00% |
| Toys | 165 | 0 | 0.00% |
National 0.45%, median 0.13%. Eight of the 22 types had no failures.
The most sampled are other foods 19,002, vegetables and fruit 18,543, meat and eggs 17,016, confectionery 9,171.
3-4 The largest reason for failure is "other"
| Reason for failure (cumulative) | Count | Share of reasons |
|---|---|---|
| Other | 247 | 51.1% |
| Coliforms | 173 | 35.8% |
| Additive use standards | 27 | 5.6% |
| Pesticide residue standards | 17 | 3.5% |
| Veterinary drug residues | 10 | 2.1% |
| Non-permitted additives | 9 | 1.9% |
| Foreign matter | 0 | 0.0% |
| Total | 483 | (1.12× the 431 failures) |
Reasons are cumulative, so one sample may carry several.
Foreign matter accounts for zero. Stories of something found in food do not appear in sampling tests. Sampling is a laboratory check, not a complaints desk.
3-5 Sampling more does not mean finding more
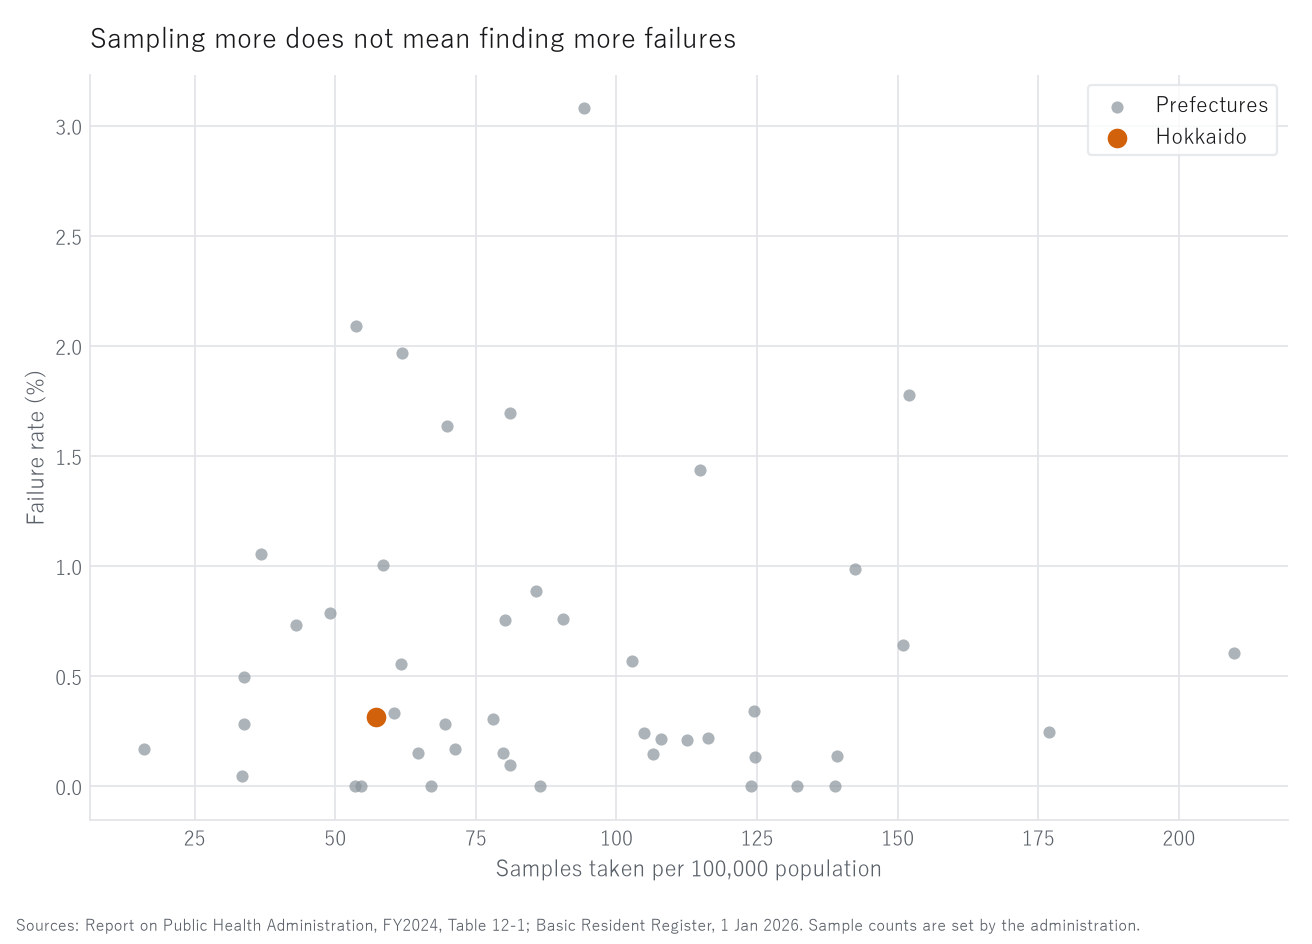
Figure 1. Sampling density against failure rate, 47 prefectures (FY2024).
Grey is prefectures, orange is Hokkaido.
| Samples per 100,000 population | |
|---|---|
| National | 77.2 |
| High | Nagasaki 209.7 / Tokushima 176.9 / Toyama 152.0 |
| Low | Hyogo 33.7 / Chiba 33.4 / Saitama 16.1 |
| Top ÷ bottom | 13.05, median 81.1 |
| Failure rate | |
|---|---|
| National | 0.45% |
| High | Kochi 3.08% (19/617) / Akita 2.09% (10/478) / Fukui 1.97% (9/457) |
| Prefectures at 0% | 7 of 47 |
| Median | 0.31% |
| Samples per food sanitation inspector | |
|---|---|
| High | Nagasaki 23.8 / Hiroshima 21.7 / Fukuoka 21.6 |
| Low | Hyogo 5.2 / Saitama 3.8 / Shimane 3.4 |
| National | 11.2, median 10.3 |
| Top ÷ bottom | 7.05 |
| Correlation (47 prefectures) | r |
|---|---|
| Samples per 100,000 × population (log) | −0.324 |
| Samples per 100,000 × failure rate | −0.031 |
| Samples per inspector × failure rate | −0.202 |
There is no relationship between sampling density and the failure rate (r = −0.031).
3-6 Hokkaido
| Samples | 2,857 (3.0% of national; population share 4.0%) |
| Failures | 9 (0.32%; national 0.45%, 23rd of 47) |
| Per 100,000 population | 57.2 (37th of 47; national 77.2) |
| Per food sanitation inspector | 7.6 (34th of 47; national 11.2) |
| Where tested | public health centres 1,489 / institute 1,242 / registered body 15 |
4. Discussion
4-1 One sample per 29.0 establishments
2,769,361 food businesses against 95,546 samples is one per 29.0 establishments.
This does not mean each establishment is checked once every 29 years. Sampling is not distributed evenly across establishments; it targets types of food and stages of distribution. One sample taken at a factory can stand for goods on many shelves.
Even so, this density is the actual scale of food sanitation administration. As I018 showed, 8,558 inspectors (1,372 full time) take 11.2 samples each a year.
4-2 How to read the absence of a relationship
Sampling density spans 13.05-fold (Nagasaki 209.7 against Saitama 16.1). Failure rates span 0% to 3.08%. Yet the two are unrelated (r = −0.031).
There are two readings.
- What turns up depends on what is sampled, not how much. The gap between ice cream at 3.38% and canned goods at 0% (3-3) supports that direction
- In prefectures with few samples, the rate moves by chance. Kochi's 3.08% is 19 of 617; a few samples either way changes it
Which dominates cannot be decided from these numbers.
What is clear, though, is that there is no simple relationship by which examining more turns up more. It runs the same way as I014's negative correlation of −0.407 between inspection rate and violation-discovery rate.
4-3 What zero foreign matter means
No failure was attributed to foreign matter.
This does not mean nothing ever gets into food. Sampling is the administration taking items away to a laboratory; what a consumer finds does not enter here.
The largest reason is "other" at 247 (51.1%), whose composition this table does not give. Next is coliforms at 173 (35.8%). That bacteriological tests are 55.8% of samples and coliforms a third of failure reasons is internally consistent.
What this statistic observes is test results against standards. Other measures of food safety exist — food poisoning statistics, recall notifications, complaints — and are not in this table.
4-4 That 90.9% is done in-house
90.9% of samples are tested in the authority's own institutions (institute of public health 36.6%, public health centre 34.7%, other 19.7%). Only 8.1% go to external registered bodies.
Local authorities hold their own testing capacity. As I018 showed, only 2,349 staff nationwide serve full time, but every prefecture has laboratories.
Staffing and equipment are separate matters. Nine tenths of the people who go out on inspections hold other duties, but the laboratories are running.
4-5 Hokkaido samples less than its population share
Hokkaido took 2,857 samples, 3.0% of the national total against 4.0% of the population, and ranks 37th per 100,000.
I016 found Hokkaido processing 17.1% of the nation's milk while taking 3.5% of the milk samples. Food runs the same way: its share of testing is low relative to its share of production.
This cannot be read as "not enough testing." The administration decides how many samples to take and what to target, and that is a matter of prefectural policy. Hokkaido's failure rate of 0.32% is below the national 0.45% and ranks mid-table at 23rd.
Its size may play a part, but this table cannot confirm it.
5. Limitations
- Sampling tests are items the administration drew, not a test of everything in circulation
- The administration decides how many samples to take. Fewer does not mean safer and more does not mean riskier
- "Type of test" counts several tests per sample, so the total exceeds the number of samples (1.13×)
- "Reasons for failure" are cumulative; one sample may carry several
- Failure rates by type move with how sampling is targeted. Sampling suspect items heavily raises the rate
- Types with fewer than 100 samples are excluded from comparison, since one or two samples move the rate sharply
- The composition of the largest reason, "other" at 247, is not given in this table
- Foreign matter found by consumers, and outbreaks of food poisoning, are not in this table
- Food business counts come from I011 (all licensed plus notified), as at end of FY2024
- The health register has no municipal table
- A correlation indicates the strength of a relationship, not the direction of causation
6. How to reproduce
- Download Tables 11 and 12-1 (Food Sanitation, sampling tests of food) of the FY2024 Report on Public Health Administration from e-Stat (CP932)
- From Table 12-1 take the national row and the 47 prefectural rows (nothing below "designated cities (regrouped)")
- From Table 11 take the 22 rows of food type
- Compute failure rates from samples and failures. Exclude types with fewer than 100 samples from comparison
- Divide by the food business counts of Tables 4-1 and 6-1 and the inspector counts of Table 13
- Compute samples per 100,000 population and correlate against the failure rate
Every figure in this paper is output by a single script (kensan_211). No intermediate value was copied by hand.
Scope of this paper
No new theory is claimed. Tables 11 and 12-1 of the Report on Public Health Administration are counted and divided by food business and inspector counts. It shows 431 failures among 95,546 samples (0.45%), one sample per 29.0 establishments, 90.9% tested in-house, failure rates from 3.38% for ice cream down to zero for eight types, zero failures attributed to foreign matter, and no relationship between sampling density and the failure rate (r = −0.031). Two readings of that absence are offered; which dominates cannot be decided. Correlations are reported; the direction of causation is not.
References and data sources
- Ministry of Health, Labour and Welfare, Report on Public Health Administration, FY2024, Tables 11, 12-1, 4-1, 6-1 and 13 (Food Sanitation)
- Ministry of Internal Affairs and Communications, Basic Resident Register population, 1 January 2026
- Yuuki Yamagishi, "865,122 Food Businesses Require Notification" (I011)
- Yuuki Yamagishi, "11,910 Shops Sell Medicines Online (12.8%)" (I014)
- Yuuki Yamagishi, "Milk Processed Differs 20,444-fold Top to Bottom" (I016). Zenodo. https://doi.org/10.5281/zenodo.22879076
- Yuuki Yamagishi, "27,227 on the Watching Side, of Whom 2,349 Are Full-Time" (I018). Zenodo. https://doi.org/10.5281/zenodo.22879207
Version history
| Version | Date | Contents |
|---|---|---|
| 1 | 2026-09-22 | First release |
How to cite
Yamagishi, Y. (2026). 95,546 Food Samples, 431 Failures (0.45%) — Sampling More Does Not Mean Finding More [I020]. Zenodo. https://doi.org/10.5281/zenodo.22879317
(This DOI is the concept DOI; it always resolves to the latest version. Cite this one.)
© 2026 Yuuki YAMAGISHI
This work is licensed under a Creative Commons Attribution 4.0 International License (CC BY 4.0).
You may copy, adapt, redistribute and use it commercially, provided you give appropriate credit.
creativecommons.org/licenses/by/4.0
All figures and values in this paper were computed from official statistics. Rights in the underlying data remain with the publishing agencies.
Reference
Yamagishi, Y. (2026). 95,546 Food Samples, 431 Failures (0.45%) [I020]. Zenodo.
DOI: 10.5281/zenodo.22879317
YOI: https://www.yamagishiyuuki.com/yoi/I020
ORCID: 0009-0006-8587-3450
PDF (English) · PDF (Japanese) · Date proof of the English PDF (OpenTimestamps .ots) · SHA256SUMS
The record page for this paper (in Japanese, with the PDFs in each language and the date proof): YOI I020. This paper is a preprint and has not been peer reviewed.