Abstract
The census population aged 100–104, 95–99, and 90–94 (2005–2020) was divided by the births in the 5 years when those people were born (Vital Statistics, 1899 onward), and the growth in population was divided into growth in "the number born" and growth in "people per birth." It claims no new mathematical theorem and no new law.
First, the tables are consistent. In the census table, total = men + women, and the re-listed 65+ equals the sum of 65–69 … 110+ for 2005–2020; for births in 1899–1930, total = men + women (apart from the one of unknown sex noted in the table) (Section 3).
Second, the population aged 100–104 grew 3.06-fold from 23,873 in 2005 to 73,008 in 2020. Over the same period, the births in the years those people were born (1901–1905 → 1916–1920) rose only 1.246-fold, from 7,395,383 to 9,213,476 (Section 4).
Third, this is the core of the paper. People aged 100–104 per birth rose 2.45-fold from 0.00323 to 0.00792, accounting for 0.803 of the growth in population in log terms. The part from growth in the number born is 0.197. At 90–94 (0.777) and 95–99 (0.738) as well, most of the growth comes from the people-per-birth side. People per birth rose continuously in 2005 → 2010 → 2015 → 2020 at every age (Section 5).
Fourth, people per birth at 100–104 are more than 5 times higher for women than for men in every year (5.93 times in 2005, 7.38 in 2020). The rise from 2005 to 2020 is also larger for women, 2.53-fold against 2.03-fold for men (Section 6).
Fifth, following the same people born in 1916–1920, people per birth are 0.11089 at 90–94 in 2010, 0.03900 at 95–99 in 2015, and 0.00792 at 100–104 in 2020 (Section 5).
Sixth, what separates them is the number of people born, or the share who survive. "More people are reaching 100" contains a rise on the survival side much larger than the growth in births 100 years earlier.
Scope note: This paper claims no new mathematical theorem and no new law — the population and births are in public tables, and dividing a ratio into factors is long established. This paper is a structural interpretation of the shape of numbers in public aggregate data; it is not medical advice, not a diagnosis, and not a treatment recommendation. The author is not a physician. Decisions about individual health should be discussed with a physician or a medical institution. This is a preprint that has not been peer reviewed. "People per birth" is close to the share who survived to around 100, but it is not a probability itself — it includes migration abroad, age reporting at high ages, the gap between the census date of 1 October and calendar years, and how births were counted 100 years ago. It does not go into the reasons people lived long (medical care, living conditions, food, and so on). It is not an outlook for any one person. About the data: the census and the Vital Statistics (e-Stat) are used under the Government Standard Terms of Use (Version 2.0), and the ratios in this paper were created by processing them. What this paper adds: dividing the growth in people reaching 100 into the growth in births 100 years earlier and the growth in people per birth, and showing, with only two public tables, that most of the growth comes from the latter, and that it is larger for women.
1. Notation and question
- Population aged 100–104: the census (1 October) population aged 100–104 (original figures).
- Births: the sum of births in the 5 years when those people were born (years t−104 to t−100 for census year t).
- People per birth: population aged 100–104 ÷ births. The same setup for 95–99 and 90–94.
- Dividing in two: log (population ratio) = log (births ratio) + log (people-per-birth ratio). Each divided by log (population ratio) is called "the share from the number born" and "the share from survival."
Question: Did the number of people reaching 100 grow because many were born 100 years ago, or because the share who survive rose?
Observation 1.1: M003 showed that life expectancy is a period value built from the same year's rates, different from a value that follows people born in the same years. M013 showed that the gain in life expectancy now comes from falling deaths at older ages. This paper compares the number of people born in the same years itself with the births 100 years earlier.
2. Survey and design
To be honest: the design was decided after seeing the tables.
| Content | |
|---|---|
| Tables | Census time-series data Table 2 (5-year age × sex, 1920–2020) and Vital Statistics Volume 1 Table 4.1 (births by year, 1899 onward) |
| Noticed in the survey | The census rows for 100–104 exist only for 2005, 2010, 2015, and 2020. The death rate past 100 was considered first, but the population by single year of age at 100+ was not in the tables at hand, so this question was taken instead |
| Aligning years | Births in 1901–1905 are matched to those aged 100–104 in 2005, and births in 1916–1920 to 2020 |
| Measures | People per birth, its rise from 2005 to 2020, the log division, and the ratio of women to men |
3. Data and checks
Calculation 3.1 The 2 retrieved files were fixed by SHA-256, and the following was checked.
- The census title is "Table 2: population and sex ratio by age (5-year groups) and sex — Japan (1920–2020)." The years are the 21 censuses every 5 years from 1920 to 2020, and the rows for 100–104, 105–109, and 110+ exist in the 4 censuses of 2005–2020.
- In the population, total = men + women in every row. For 2005–2020, the re-listed 65+ equals the sum of 65–69 … 110+ for both sexes, men, and women.
- The births title is "Volume 1, Births, Table 4.1: births … by year." Every year 1899–1930 is present, and total = men + women (in 1926 and 1930 they differ by only the one of unknown sex, as the table notes).
- For 2020, those aged 100–104 are 73,008 in the original figures and 73,806 with imputed unknowns (※), a ratio of 1.0109. Original figures are used to align the 4 years.
4. Population aged 100–104 and births 100 years earlier
Calculation 4.1 Population aged 100–104 and births in the 5 years when those people were born
| Year | Aged 100–104 | Men | Women | Birth years | Births | People per birth |
|---|---|---|---|---|---|---|
| 2005 | 23,873 | 3,580 | 20,293 | 1901–1905 | 7,395,383 | 0.00323 |
| 2010 | 41,318 | 5,598 | 35,720 | 1906–1910 | 8,078,289 | 0.00511 |
| 2015 | 57,847 | 7,991 | 49,856 | 1911–1915 | 8,850,646 | 0.00654 |
| 2020 | 73,008 | 9,051 | 63,957 | 1916–1920 | 9,213,476 | 0.00792 |
Observation 4.2: The population aged 100–104 grew 3.06-fold from 23,873 in 2005 to 73,008 in 2020, but births in the years they were born grew only 1.246-fold. Those aged 105–109 went from 1,458 to 6,374, and 110+ from 22 to 141 (for 110+, the 146 in 2015 is higher).
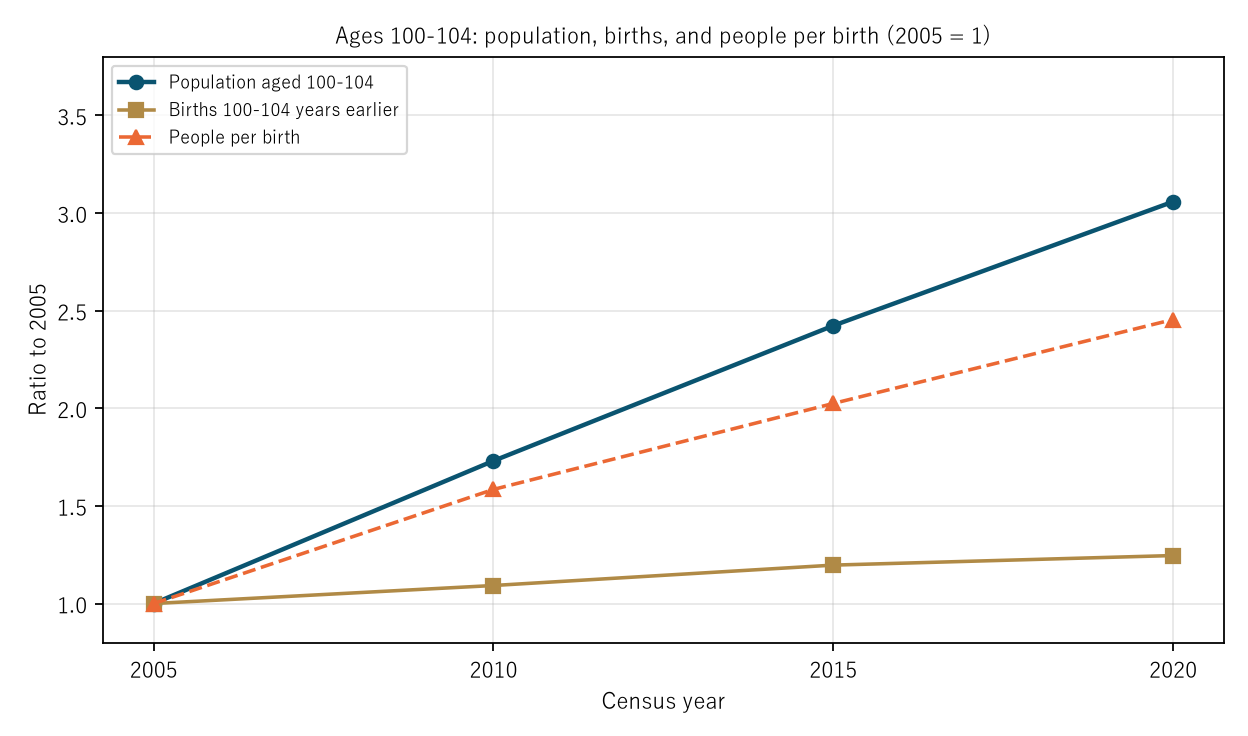
Figure 1: Population aged 100–104 (navy), births in the 5 years when they were born (gold), and people per birth (orange dashed), as ratios to 2005.
5. Core — most of the growth comes from the survival side
Calculation 5.1 Dividing the growth in population from 2005 to 2020
| Age and sex | Population | Births | People per birth | Share from number born | Share from survival |
|---|---|---|---|---|---|
| 90–94, both sexes | 2.12 | 1.182 | 1.79 | 0.223 | 0.777 |
| 90–94, men | 2.33 | 1.184 | 1.97 | 0.199 | 0.801 |
| 90–94, women | 2.04 | 1.181 | 1.73 | 0.232 | 0.768 |
| 95–99, both sexes | 2.33 | 1.249 | 1.87 | 0.262 | 0.738 |
| 95–99, men | 2.22 | 1.246 | 1.79 | 0.275 | 0.725 |
| 95–99, women | 2.36 | 1.252 | 1.88 | 0.262 | 0.738 |
| 100–104, both sexes | 3.06 | 1.246 | 2.45 | 0.197 | 0.803 |
| 100–104, men | 2.53 | 1.245 | 2.03 | 0.236 | 0.764 |
| 100–104, women | 3.15 | 1.247 | 2.53 | 0.192 | 0.808 |
Observation 5.2: For both sexes at 100–104, population 3.06-fold = births 1.246-fold × people per birth 2.45-fold, and 0.803 of the growth in log terms comes from people per birth. The same holds at 90–94 (0.777) and 95–99 (0.738): at every age and sex, the rise in people per birth is larger than the rise in births.
Calculation 5.3 People per birth by year and age
| Year | 90–94 | 95–99 | 100–104 |
|---|---|---|---|
| 2005 | 0.09501 | 0.02615 | 0.00323 |
| 2010 | 0.11089 | 0.03353 | 0.00511 |
| 2015 | 0.13373 | 0.03900 | 0.00654 |
| 2020 | 0.17003 | 0.04884 | 0.00792 |
Observation 5.4: People per birth rose continuously in 2005 → 2010 → 2015 → 2020 at every age. Following the same people born in 1916–1920, it is 0.11089 at 90–94 in 2010, 0.03900 at 95–99 in 2015, and 0.00792 at 100–104 in 2020 (all three use the same births as the denominator).
6. Men and women
Calculation 6.1 Women ÷ men at 100–104
| Year | Population | Births | People per birth |
|---|---|---|---|
| 2005 | 5.67 | 0.956 | 5.93 |
| 2010 | 6.38 | 0.955 | 6.68 |
| 2015 | 6.24 | 0.958 | 6.51 |
| 2020 | 7.07 | 0.958 | 7.38 |
Observation 6.2: People per birth at 100–104 are more than 5 times higher for women than for men in every year, from 5.93 times in 2005 to 7.38 in 2020. Slightly fewer girls were born (0.955–0.958), so the women-to-men ratio of population (5.67–7.07) comes almost entirely from the difference in people per birth. The rise from 2005 to 2020 is also larger for women, 2.53-fold against 2.03-fold for men.
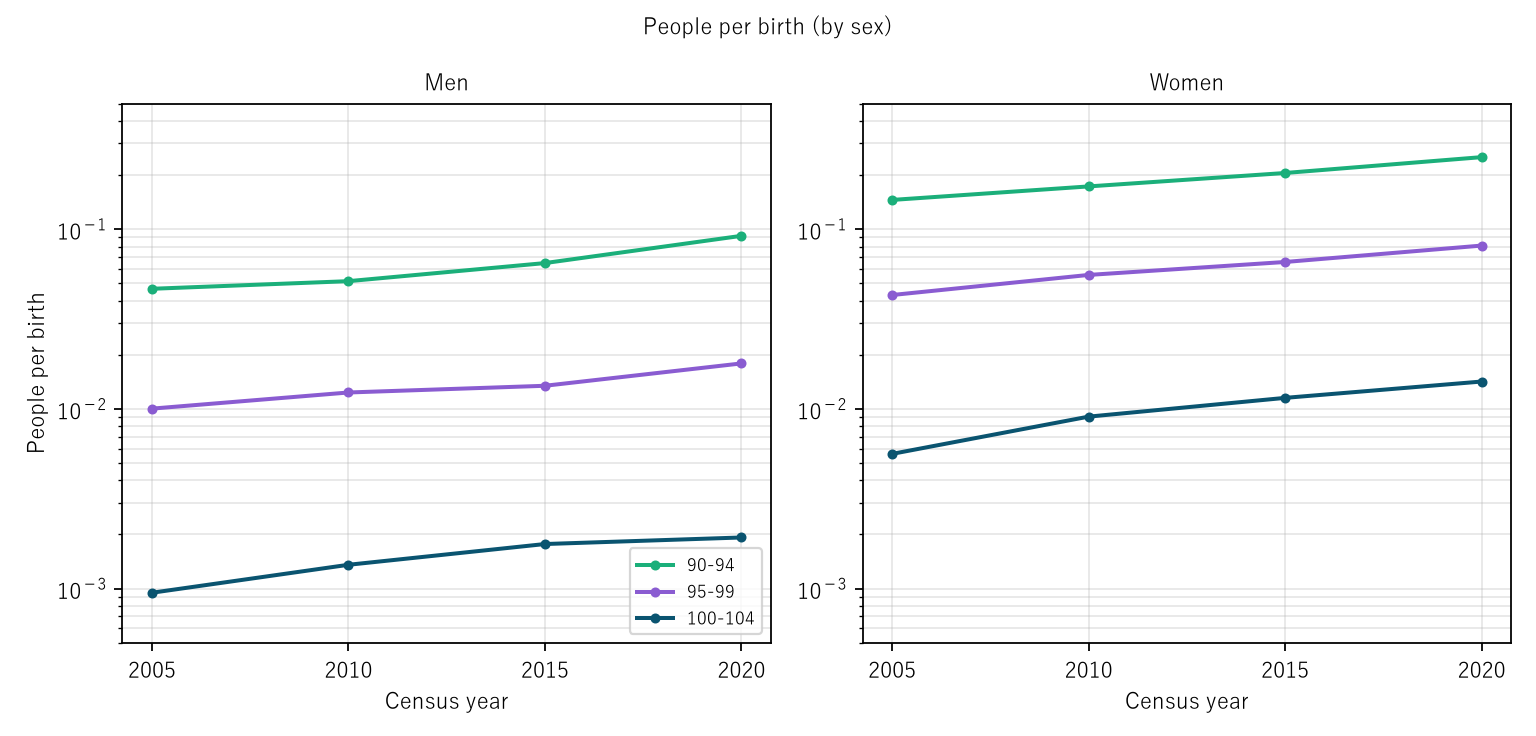
Figure 2: People per birth (vertical axis logarithmic). Men left, women right. Green is 90–94, purple 95–99, and navy 100–104.
7. Limitations
- People per birth is not a probability itself. It includes migration (people born here 100 years ago who went abroad, and people born abroad who came in), age reporting at high ages, the gap between 1 October and calendar years, and how births were counted 100 years ago.
- The census rows for 100–104 exist only in the 4 censuses of 2005–2020; earlier years cannot be compared.
- It does not go into the reasons people lived long (medical care, living conditions, food, and so on).
- Prefectures are not compared. It is not an outlook for any one person.
Conclusion
The population aged 100–104 grew 3.06-fold from 2005 to 2020, but births in the years those people were born rose only 1.246-fold. The 2.45-fold rise in people per birth, from 0.00323 to 0.00792, accounted for 0.803 of the growth in log terms. Women's figure was more than 5 times men's, and it rose more.
One thing separates them — the number of people born, or the share who survive.
On hearing "more people are reaching 100," check together whether many were born 100 years ago, or whether the share who survive rose.
Data and reproduction
| Data | Census time-series data Table 2 (Statistics Bureau, Ministry of Internal Affairs and Communications) and Vital Statistics 2024 (final figures), Volume 1 Table 4.1 (Ministry of Health, Labour and Welfare) (both from e-Stat; retrieved 26 September 2026) |
| Terms of use | e-Stat follows the Government Standard Terms of Use (Version 2.0). The ratios in this paper were created by processing these and are not figures produced by the government |
| Scope | Japan, 2005–2020 (births 1899–1930) |
| Checker | 検算/M062.py (--zu also draws the figures). Every number in the text is taken from 検算/M062_output.txt |
| Raw data | The 2 retrieved files and SOURCES.md in data/ (URLs, retrieval date, SHA-256, terms of use, definitions and how calculations are set up) |
| Figures | 図/M062_zu1, 図/M062_zu2 (png, svg, English versions) |
References
- Ministry of Health, Labour and Welfare. Vital Statistics 2024 (final figures), Volume 1 Table 4.1 (in Japanese). e-Stat (accessed 26 September 2026). https://www.e-stat.go.jp/
- Statistics Bureau, Ministry of Internal Affairs and Communications. Census time-series data, Table 2, population and sex ratio by age (5-year groups) and sex — Japan (1920–2020) (in Japanese). e-Stat (accessed 26 September 2026). https://www.e-stat.go.jp/
- Yamagishi, Y. (2026). Life Expectancy Is Not the Number of Years Anyone Actually Lives [M003]. Zenodo. https://doi.org/10.5281/zenodo.22963485
- Yamagishi, Y. (2026). Gains in Life Expectancy Came First from Fewer Deaths at Young Ages, Now from Fewer at Old Ages [M013]. Zenodo. https://doi.org/10.5281/zenodo.22966888
Reference
Yamagishi, Y. (2026). The Population Aged 100–104 Grew 3.06-Fold from 2005 to 2020, but Births 100–104 Years Earlier Grew Only 1.246-Fold [M062]. Zenodo.
DOI: 10.5281/zenodo.22976523
YOI: https://www.yamagishiyuuki.com/yoi/M062
ORCID: 0009-0006-8587-3450
PDF (English) · PDF (Japanese) · Date proof of the English PDF (OpenTimestamps .ots) · SHA256SUMS
The record page for this paper (in Japanese, with the PDFs in each language and the date proof): YOI M062. This paper is a preprint and has not been peer reviewed.